Cisco 2008 Annual Report Download - page 43
Download and view the complete annual report
Please find page 43 of the 2008 Cisco annual report below. You can navigate through the pages in the report by either clicking on the pages listed below, or by using the keyword search tool below to find specific information within the annual report.-
 1
1 -
2
-
3
-
4
-
5
-
6
-
7
-
8
-
9
-
10
-
11
-
12
-
13
-
14
-
15
-
16
-
17
-
18
-
19
-
20
-
21
-
22
-
23
-
24
-
25
-
26
-
27
-
28
-
29
-
30
-
31
-
32
-
 33
33 -
 34
34 -
 35
35 -
 36
36 -
 37
37 -
 38
38 -
 39
39 -
 40
40 -
 41
41 -
 42
42 -
 43
43 -
 44
44 -
 45
45 -
 46
46 -
 47
47 -
 48
48 -
 49
49 -
 50
50 -
 51
51 -
 52
52 -
 53
53 -
54
-
55
-
56
-
57
-
58
-
59
-
60
-
61
-
62
-
63
-
64
-
65
-
66
-
67
-
68
-
69
-
70
-
71
-
72
-
73
-
74
-
75
-
76
-
77
-
78
-
79
-
80
-
81
 |
 |
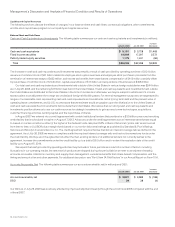
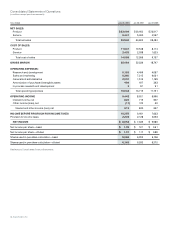
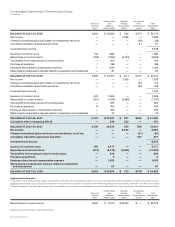
48 Cisco Systems, Inc.
Years Ended July 26, 2008 July 28, 2007 July 29, 2006
NET SALES:
Product $ 33,099 $ 29,462 $ 23,917
Service 6,441 5,460 4,567
Total net sales 39,540 34,922 28,484
COST OF SALES:
Product 11,631 10,548 8,114
Service 2,425 2,038 1,623
Total cost of sales 14,056 12,586 9,737
GROSS MARGIN 25,484 22,336 18,747
OPERATING EXPENSES:
Research and development 5,153 4,499 4,067
Sales and marketing 8,380 7,215 6,031
General and administrative 2,007 1,513 1,169
Amortization of purchased intangible assets 499 407 393
In-process research and development 3 81 91
Total operating expenses 16,042 13,715 11,751
OPERATING INCOME 9,442 8,621 6,996
Interest income, net 824 715 607
Other income (loss), net (11) 125 30
Interest and other income (loss), net 813 840 637
INCOME BEFORE PROVISION FOR INCOME TAXES 10,255 9,461 7,633
Provision for income taxes 2,203 2,128 2,053
NET INCOME $ 8,052 $ 7,333 $ 5,580
Net income per share—basic $ 1.35 $ 1.21 $ 0.91
Net income per share—diluted $ 1.31 $ 1.17 $ 0.89
Shares used in per-share calculation—basic 5,986 6,055 6,158
Shares used in per-share calculation—diluted 6,163 6,265 6,272
See Notes to Consolidated Financial Statements.
Consolidated Statements of Operations
(in millions, except per-share amounts)