Cisco 2008 Annual Report Download - page 77
Download and view the complete annual report
Please find page 77 of the 2008 Cisco annual report below. You can navigate through the pages in the report by either clicking on the pages listed below, or by using the keyword search tool below to find specific information within the annual report.-
 1
1 -
2
-
3
-
4
-
5
-
6
-
7
-
8
-
9
-
10
-
11
-
12
-
13
-
14
-
15
-
16
-
17
-
18
-
19
-
20
-
21
-
22
-
23
-
24
-
25
-
26
-
27
-
28
-
29
-
30
-
31
-
32
-
33
-
34
-
35
-
36
-
37
-
38
-
39
-
40
-
41
-
42
-
43
-
44
-
45
-
46
-
47
-
48
-
49
-
50
-
51
-
52
-
53
-
54
-
55
-
56
-
57
-
58
-
59
-
60
-
61
-
62
-
63
-
64
-
65
-
66
-
 67
67 -
 68
68 -
 69
69 -
 70
70 -
 71
71 -
 72
72 -
 73
73 -
 74
74 -
 75
75 -
 76
76 -
 77
77 -
 78
78 -
 79
79 -
 80
80 -
 81
81
 |
 |

82 Cisco Systems, Inc.
Notes to Consolidated Financial Statements
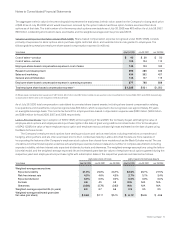
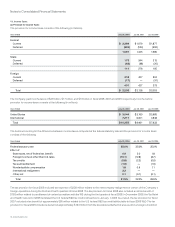
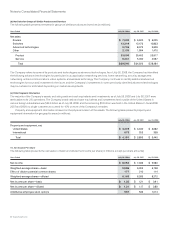
(b) Net Sales for Groups of Similar Products and Services
The following table presents net sales for groups of similar products and services (in millions):
Years Ended July 26, 2008 July 28, 2007 July 29, 2006
Net sales:
Routers $ 7,909 $ 6,920 $ 6,005
Switches 13,319 12,473 10,833
Advanced technologies 9,736 8,075 5,609
Other 2,135 1,994 1,470
Product 33,099 29,462 23,917
Service 6,441 5,460 4,567
Total $ 39,540 $ 34,922 $ 28,484
The Company refers to some of its products and technologies as advanced technologies. As of July 26, 2008, the Company had identified
the following advanced technologies for particular focus: application networking services, home networking, security, storage area
networking, unified communications, video systems, and wireless technology. The Company continues to identify additional advanced
technologies for focus and investment in the future, and the Company’s investments in some previously identified advanced technologies
may be curtailed or eliminated depending on market developments.
(c) Other Segment Information
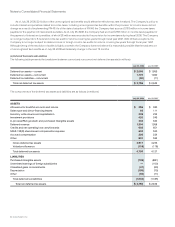
The majority of the Company’s assets, excluding cash and cash equivalents and investments, as of July 26, 2008 and July 28, 2007 were
attributable to its U.S. operations. The Company’s total cash and cash equivalents and investments held outside of the United States in
various foreign subsidiaries was $24.4 billion as of July 26, 2008, and the remaining $1.8 billion was held in the United States. In fiscal 2008,
2007, and 2006, no single customer accounted for 10% or more of the Company’s net sales.
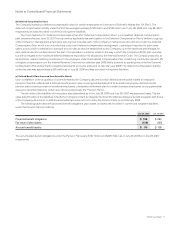
Property and equipment information is based on the physical location of the assets. The following table presents property and
equipment information for geographic areas (in millions):
July 26, 2008 July 28, 2007 July 29, 2006
Property and equipment, net:
United States $ 3,478 $ 3,340 $ 3,082
International 673 553 358
Total $ 4,151 $ 3,893 $ 3,440
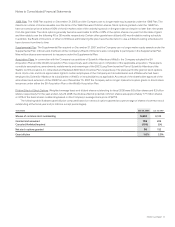
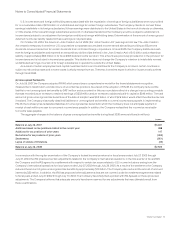
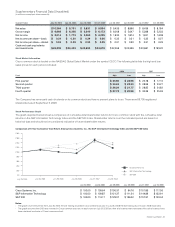
15. Net Income Per Share
The following table presents the calculation of basic and diluted net income per share (in millions, except per-share amounts):
Years Ended July 26, 2008 July 28, 2007 July 29, 2006
Net income $ 8,052 $ 7,333 $ 5,580
Weighted-average shares—basic 5,986 6,055 6,158
Effect of dilutive potential common shares 177 210 114
Weighted-average shares—diluted 6,163 6,265 6,272
Net income per share—basic $ 1.35 $ 1.21 $ 0.91
Net income per share—diluted $ 1.31 $ 1.17 $ 0.89
Antidilutive employee stock options 567 533 1,014