Cisco 2008 Annual Report Download - page 24
Download and view the complete annual report
Please find page 24 of the 2008 Cisco annual report below. You can navigate through the pages in the report by either clicking on the pages listed below, or by using the keyword search tool below to find specific information within the annual report.-
 1
1 -
2
-
3
-
4
-
5
-
6
-
7
-
8
-
9
-
10
-
11
-
12
-
13
-
 14
14 -
 15
15 -
 16
16 -
 17
17 -
 18
18 -
 19
19 -
 20
20 -
 21
21 -
 22
22 -
 23
23 -
 24
24 -
 25
25 -
 26
26 -
 27
27 -
 28
28 -
 29
29 -
 30
30 -
 31
31 -
 32
32 -
 33
33 -
 34
34 -
35
-
36
-
37
-
38
-
39
-
40
-
41
-
42
-
43
-
44
-
45
-
46
-
47
-
48
-
49
-
50
-
51
-
52
-
53
-
54
-
55
-
56
-
57
-
58
-
59
-
60
-
61
-
62
-
63
-
64
-
65
-
66
-
67
-
68
-
69
-
70
-
71
-
72
-
73
-
74
-
75
-
76
-
77
-
78
-
79
-
80
-
81
 |
 |

2008 Annual Report 29
Management’s Discussion and Analysis of Financial Condition and Results of Operations
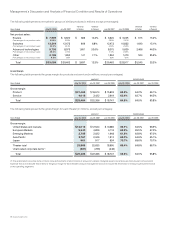
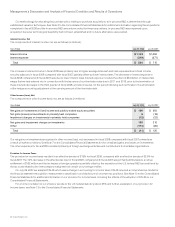
• Sales of security products increased by approximately $180 million, primarily due to revenue from IronPort Systems, Inc., which we
acquired during the fourth quarter of fiscal 2007; revenue from module and line card sales related to our routers and LAN switches
as customers continued to emphasize network security; and revenue from sales of our next-generation adaptive security appliance
products, which integrate multiple technologies, including virtual private network (VPN), firewall, and intrusion prevention services,
on one platform.
• Sales of application networking services increased by approximately $125 million. The increase was primarily due to higher demand
from customers for wide-area network (WAN) optimization solutions.
• Sales of wireless LAN, home networking, and storage area networking products increased by approximately $75 million, $55 million,
and $50 million, respectively.
Other Product Revenue The increase in other product revenue in fiscal 2008 compared with fiscal 2007 was primarily due to an increase
in sales of cable products, Cisco TelePresence systems, and other emerging technology products.
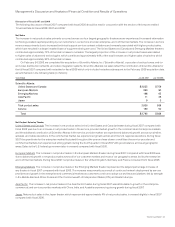
Net Service Revenue
The increase in net service revenue in fiscal 2008 compared with fiscal 2007 was primarily due to increased technical support service
contract initiations and renewals associated with higher product sales, which have resulted in a larger installed base of equipment being
serviced, and increased revenue from advanced services, which relates to consulting support services for specific networking needs.
The increase in advanced services revenue in fiscal 2008, compared with fiscal 2007, was attributable primarily to our revenue growth
in the Emerging Markets theater, advanced technologies products, and our service provider market.
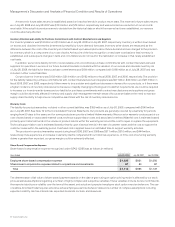
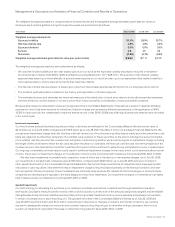
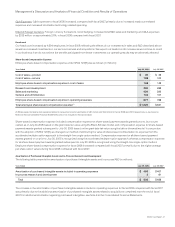
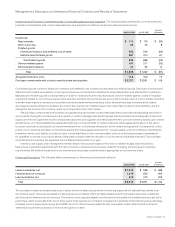
Gross Margin
Gross margin percentage increased during fiscal 2008 compared with fiscal 2007 primarily due to the factors described under “Product
Gross Margin” below, partially offset by the slight decrease in service gross margin percentage described below. The gross margin for
each theater is derived from information from our internal management system. The gross margin percentage for a particular theater may
fluctuate and period-to-period changes in such percentages may or may not be indicative of a trend for that theater.
Product Gross Margin
The increase in product gross margin percentage during fiscal 2008 compared with fiscal 2007 was due to the following factors:
• Lower overall manufacturing costs related to lower component costs and value engineering, partially offset by other manufacturing-
related costs, increased product gross margin percentage by 2.1%. Value engineering is the process by which production costs are
reduced through component redesign, board configuration, test processes, and transformation processes.
• Higher shipment volume, net of certain variable costs, increased product gross margin percentage by 0.5%.
• Sales discounts, rebates, and product pricing decreased product gross margin percentage by 1.7%.
• Changes in the mix of products sold decreased product gross margin percentage by 0.1%.
• Net effects of amortization of purchased intangible assets and share-based compensation expense decreased product gross margin
percentage by 0.1%.
Service Gross Margin
Our service gross margin percentage decreased slightly in fiscal 2008 compared with fiscal 2007 due primarily to advanced services
constituting a higher proportion of total service revenue in fiscal 2008. Our service gross margin from technical support services is higher
than the service gross margin from our advanced services, and our revenue from advanced services may continue to increase to a higher
proportion of total service revenue due to our continued focus on providing comprehensive support to our customers’ networking devices,
applications, and infrastructures. Additionally, we have continued to invest in building out our technical support and advanced services
capabilities in the Emerging Markets theater.