Cisco 2008 Annual Report Download - page 33
Download and view the complete annual report
Please find page 33 of the 2008 Cisco annual report below. You can navigate through the pages in the report by either clicking on the pages listed below, or by using the keyword search tool below to find specific information within the annual report.-
 1
1 -
2
-
3
-
4
-
5
-
6
-
7
-
8
-
9
-
10
-
11
-
12
-
13
-
14
-
15
-
16
-
17
-
18
-
19
-
20
-
21
-
22
-
 23
23 -
 24
24 -
 25
25 -
 26
26 -
 27
27 -
 28
28 -
 29
29 -
 30
30 -
 31
31 -
 32
32 -
 33
33 -
 34
34 -
 35
35 -
 36
36 -
 37
37 -
 38
38 -
 39
39 -
 40
40 -
 41
41 -
 42
42 -
 43
43 -
44
-
45
-
46
-
47
-
48
-
49
-
50
-
51
-
52
-
53
-
54
-
55
-
56
-
57
-
58
-
59
-
60
-
61
-
62
-
63
-
64
-
65
-
66
-
67
-
68
-
69
-
70
-
71
-
72
-
73
-
74
-
75
-
76
-
77
-
78
-
79
-
80
-
81
 |
 |
38 Cisco Systems, Inc.
Management’s Discussion and Analysis of Financial Condition and Results of Operations
Liquidity and Capital Resources
The following sections discuss the effects of changes in our balance sheet and cash flows, contractual obligations, other commitments,
and the stock repurchase program on our liquidity and capital resources.
Balance Sheet and Cash Flows
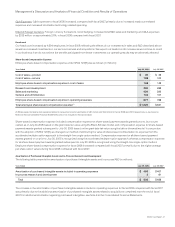
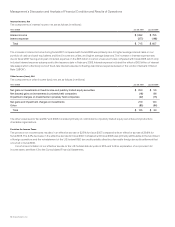
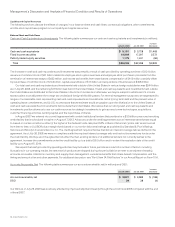
Cash and Cash Equivalents and Investments The following table summarizes our cash and cash equivalents and investments (in millions):
July 28, 2007
Increase
(Decrease)July 26, 2008
Cash and cash equivalents $ 5,191 $ 3,728 $ 1,463
Fixed income securities 19,869 17,297 2,572
Publicly traded equity securities 1,175 1,241 (66)
Total $ 26,235 $ 22,266 $ 3,969
The increase in cash and cash equivalents and investments was primarily a result of cash provided by operating activities of $12.1 billion,
issuance of common stock of $3.1 billion related to employee stock option exercises and employee stock purchases, proceeds from the
termination of interest rate swaps of $432 million, and excess tax benefits from share-based compensation of $413 million, partially offset
by repurchase of common stock of $10.4 billion, capital expenditures of $1.3 billion, and acquisitions of businesses of $398 million.
Our total cash and cash equivalents and investments held outside of the United States in various foreign subsidiaries was $24.4 billion
as of July 26, 2008, and the remaining $1.8 billion was held in the United States. If cash and cash equivalents and investments held outside
the United States are distributed to the United States in the form of dividends or otherwise, we may be subject to additional U.S. income
taxes (subject to an adjustment for foreign tax credits) and foreign withholding taxes. For internal management purposes, we target specific
ranges of net realizable cash, representing cash and cash equivalents and investments, net of (i) long-term debt and the present value of
operating lease commitments, and (ii) U.S. income taxes that we estimate would be payable upon the distribution to the United States of
cash and cash equivalents and investments held outside the United States. We believe that our strong cash and cash equivalents and
investments position allows us to use our cash resources for strategic investments to gain access to new technologies, acquisitions,
customer financing activities, working capital, and the repurchase of shares.
In August 2007 we entered into a credit agreement with certain institutional lenders that provides for a $3.0 billion unsecured revolving
credit facility that is scheduled to expire on August 17, 2012. Advances under the credit agreement accrue interest at rates that are equal
to, based on certain conditions, either (i) the higher of the Federal Funds rate plus 0.50% or Bank of America’s “prime rate” as announced
from time to time, or (ii) LIBOR plus a margin that is based on our senior debt credit ratings as published by Standard & Poor’s Ratings
Services and Moody’s Investors Service, Inc. The credit agreement requires that we maintain an interest coverage ratio as defined in the
agreement. As of July 26, 2008, we were in compliance with the required interest coverage ratio and had not borrowed any funds under
the credit facility. We may, upon the agreement of either the then existing lenders or of additional lenders not currently parties to the
agreement, increase the commitments under the credit facility up to a total of $5.0 billion and/or extend the expiration date of the credit
facility up to August 15, 2014.
We expect that cash provided by operating activities may fluctuate in future periods as a result of a number of factors, including
fluctuations in our operating results, the rate at which products are shipped during the period (which we refer to as shipment linearity),
accounts receivable collections, inventory and supply chain management, excess tax benefits from share-based compensation, and the
timing and amount of tax and other payments. For additional discussion, see “Part I, Item 1A. Risk Factors” in our Annual Report on Form 10-K.
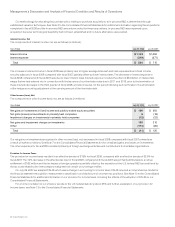
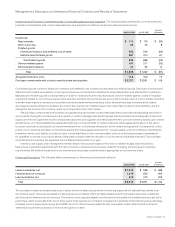
Accounts Receivable, Net The following table summarizes our accounts receivable, net (in millions) and DSO:
July 28, 2007
Increase
(Decrease)July 26, 2008
Accounts receivable, net $ 3,821 $ 3,989 $ (168)
DSO 34 38 (4)
Our DSO as of July 26, 2008 was positively affected by improved shipment linearity through the end of fiscal 2008 compared with the end
of fiscal 2007.