Cisco 2008 Annual Report Download - page 70
Download and view the complete annual report
Please find page 70 of the 2008 Cisco annual report below. You can navigate through the pages in the report by either clicking on the pages listed below, or by using the keyword search tool below to find specific information within the annual report.-
 1
1 -
2
-
3
-
4
-
5
-
6
-
7
-
8
-
9
-
10
-
11
-
12
-
13
-
14
-
15
-
16
-
17
-
18
-
19
-
20
-
21
-
22
-
23
-
24
-
25
-
26
-
27
-
28
-
29
-
30
-
31
-
32
-
33
-
34
-
35
-
36
-
37
-
38
-
39
-
40
-
41
-
42
-
43
-
44
-
45
-
46
-
47
-
48
-
49
-
50
-
51
-
52
-
53
-
54
-
55
-
56
-
57
-
58
-
59
-
 60
60 -
 61
61 -
 62
62 -
 63
63 -
 64
64 -
 65
65 -
 66
66 -
 67
67 -
 68
68 -
 69
69 -
 70
70 -
 71
71 -
 72
72 -
 73
73 -
 74
74 -
 75
75 -
 76
76 -
 77
77 -
 78
78 -
 79
79 -
 80
80 -
81
 |
 |
2008 Annual Report 75
Notes to Consolidated Financial Statements
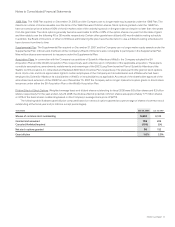
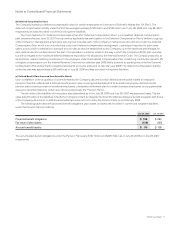
The aggregate intrinsic value in the preceding table represents the total pretax intrinsic value, based on the Company’s closing stock price
of $22.43 as of July 25, 2008, which would have been received by the option holders had those option holders exercised their stock
options as of that date. The total number of in-the-money stock options exercisable as of July 26, 2008 was 463 million. As of July 28, 2007,
829 million outstanding stock options were exercisable and the weighted-average exercise price was $30.13.
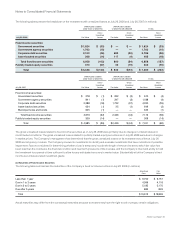
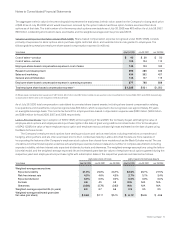
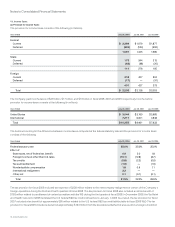
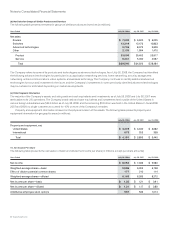
Valuation and Expense Information Under SFAS 123(R) Share-based compensation expense recognized under SFAS 123(R) consists
primarily of expenses for stock options, stock purchase rights, restricted stock, and restricted stock units granted to employees. The
following table summarizes employee share-based compensation expense (in millions):
Years Ended July 26, 2008 July 28, 2007 July 29, 2006
Cost of sales—product $ 40 $ 39 $ 50
Cost of sales—service 108 104 112
Employee share-based compensation expense in cost of sales 148 143 162
Research and development 295 289 346
Sales and marketing 434 392 427
General and administrative 148 107 115
Employee share-based compensation expense in operating expenses 877 788 888
Total employee share-based compensation expense(1) $ 1,025 $ 931 $ 1,050
(1) Share-based compensation expense of $87 million, $34 million, and $87 million related to acquisitions and investments for fiscal 2008, 2007, and 2006, respectively,
is disclosed in Note 3 and is not included in the above table.
As of July 26, 2008, total compensation cost related to unvested share-based awards, including share-based compensation relating
to acquisitions and investments, not yet recognized was $3.4 billion, which is expected to be recognized over approximately 3.5 years
on a weighted-average basis. The income tax benefit for employee share-based compensation expense was $330 million, $342 million,
and $294 million for fiscal 2008, 2007, and 2006, respectively.
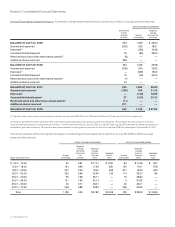
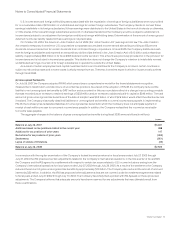
Lattice-Binomial Model Upon adoption of SFAS 123(R) at the beginning of fiscal 2006, the Company began estimating the value of
employee stock options and employee stock purchase rights on the date of grant using a lattice-binomial model. Prior to the adoption
of SFAS 123(R), the value of each employee stock option and employee stock purchase right was estimated on the date of grant using
the Black-Scholes model.
The Company’s employee stock options have vesting provisions and various restrictions including restrictions on transfer and
hedging, among others, and are often exercised prior to their contractual maturity. Lattice-binomial models are more capable of
incorporating the features of the Company’s employee stock options than closed-form models such as the Black-Scholes model. The use
of a lattice-binomial model requires extensive actual employee exercise behavior data and a number of complex assumptions including
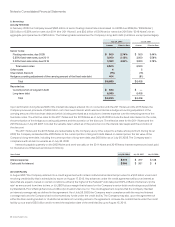
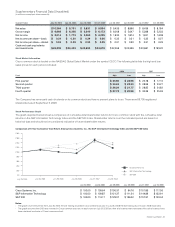
expected volatility, risk-free interest rate, expected dividends, kurtosis, and skewness. The weighted-average assumptions, using the lattice-
binomial model, and the weighted-average expected life and estimated grant date fair values of employee stock options granted during the
respective years and employee stock purchase rights with subscription dates in the respective years are summarized as follows:
EMPLOYEE STOCK OPTIONS EMPLOYEE STOCK PURCHASE RIGHTS
Years Ended July 26, 2008 July 28, 2007 July 29, 2006 July 26, 2008 July 28, 2007 July 29, 2006
Weighted-average assumptions:
Expected volatility 31.0% 26.0% 23.7% 32.6% 26.1% 27.5%
Risk-free interest rate 4.3% 4.6% 4.3% 2.7% 5.1% 3.4%
Expected dividend 0.0% 0.0% 0.0% 0.0% 0.0% 0.0%
Kurtosis 4.6 4.5 4.3 N/A N/A N/A
Skewness (0.80) (0.79) (0.62) N/A N/A N/A
Weighted-average expected life (in years) 6.3 6.7 6.6 0.5 0.5 0.5
Weighted-average estimated grant date
fair value (per share) $ 9.60 $ 7.11 $ 5.15 $ 6.12 $ 6.46 $ 4.66