Cisco 2008 Annual Report Download - page 17
Download and view the complete annual report
Please find page 17 of the 2008 Cisco annual report below. You can navigate through the pages in the report by either clicking on the pages listed below, or by using the keyword search tool below to find specific information within the annual report.-
 1
1 -
2
-
3
-
4
-
5
-
6
-
 7
7 -
 8
8 -
 9
9 -
 10
10 -
 11
11 -
 12
12 -
 13
13 -
 14
14 -
 15
15 -
 16
16 -
 17
17 -
 18
18 -
 19
19 -
 20
20 -
 21
21 -
 22
22 -
 23
23 -
 24
24 -
 25
25 -
 26
26 -
 27
27 -
28
-
29
-
30
-
31
-
32
-
33
-
34
-
35
-
36
-
37
-
38
-
39
-
40
-
41
-
42
-
43
-
44
-
45
-
46
-
47
-
48
-
49
-
50
-
51
-
52
-
53
-
54
-
55
-
56
-
57
-
58
-
59
-
60
-
61
-
62
-
63
-
64
-
65
-
66
-
67
-
68
-
69
-
70
-
71
-
72
-
73
-
74
-
75
-
76
-
77
-
78
-
79
-
80
-
81
 |
 |

22 Cisco Systems, Inc.
Management’s Discussion and Analysis of Financial Condition and Results of Operations
A reserve for future sales returns is established based on historical trends in product return rates. The reserve for future sales returns
as of July 26, 2008 and July 28, 2007 was $103 million and $74 million, respectively, and was recorded as a reduction of our accounts
receivable. If the actual future returns were to deviate from the historical data on which the reserve had been established, our revenue
could be adversely affected.
Inventory Valuation and Liability for Purchase Commitments with Contract Manufacturers and Suppliers
Our inventory balance was $1.2 billion and $1.3 billion as of July 26, 2008 and July 28, 2007, respectively. Inventory is written down based
on excess and obsolete inventories determined primarily by future demand forecasts. Inventory write-downs are measured as the
difference between the cost of the inventory and market based upon assumptions about future demand and are charged to the provision
for inventory, which is a component of our cost of sales. At the point of the loss recognition, a new, lower cost basis for that inventory is
established, and subsequent changes in facts and circumstances do not result in the restoration or increase in that newly established
cost basis.
In addition, we record a liability for firm, noncancelable, and unconditional purchase commitments with contract manufacturers and
suppliers for quantities in excess of our future demand forecasts consistent with the valuation of our excess and obsolete inventory. As
of July 26, 2008, the liability for these purchase commitments was $184 million, compared with $168 million as of July 28, 2007, and was
included in other current liabilities.
Our provision for inventory was $102 million, $214 million, and $162 million for fiscal 2008, 2007, and 2006, respectively. The provision
for the liability related to purchase commitments with contract manufacturers and suppliers was $97 million, $34 million, and $61 million in
fiscal 2008, 2007, and 2006, respectively. If there were to be a sudden and significant decrease in demand for our products, or if there were
a higher incidence of inventory obsolescence because of rapidly changing technology and customer requirements, we could be required
to increase our inventory write-downs and our liability for purchase commitments with contract manufacturers and suppliers and gross
margin could be adversely affected. Inventory and supply chain management remain areas of focus as we balance the need to maintain
supply chain flexibility to help ensure competitive lead times with the risk of inventory obsolescence.
Warranty Costs
The liability for product warranties, included in other current liabilities, was $399 million as of July 26, 2008, compared with $340 million
as of July 28, 2007. See Note 10 to the Consolidated Financial Statements. Our products are generally covered by a warranty for periods
ranging from 90 days to five years, and for some products we provide a limited lifetime warranty. We accrue for warranty costs as part of our
cost of sales based on associated material costs, technical support labor costs, and associated overhead. Material cost is estimated based
primarily upon historical trends in the volume of product returns within the warranty period and the cost to repair or replace the equipment.
Technical support labor cost is estimated based primarily upon historical trends in the rate of customer cases and the cost to support the
customer cases within the warranty period. Overhead cost is applied based on estimated time to support warranty activities.
The provision for product warranties issued during fiscal 2008, 2007, and 2006 was $511 million, $510 million, and $444 million,
respectively. If we experience an increase in warranty claims compared with our historical experience, or if the cost of servicing warranty
claims is greater than expected, our gross margin could be adversely affected.
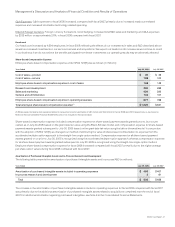
Share-Based Compensation Expense
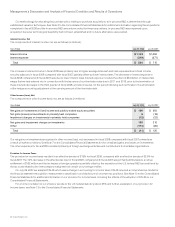
Share-based compensation expense recognized under SFAS 123(R) was as follows (in millions):
Years Ended July 26, 2008 July 28, 2007 July 29, 2006
Employee share-based compensation expense $ 1,025 $ 931 $ 1,050
Share-based compensation expense related to acquisitions and investments 87 34 87
Total $ 1,112 $ 965 $ 1,137
The determination of fair value of share-based payment awards on the date of grant using an option-pricing model is affected by our stock
price as well as assumptions regarding a number of highly complex and subjective variables. These variables include, but are not limited to,
the expected stock price volatility over the term of the award, and actual and projected employee stock option exercise behaviors. The use
of a lattice-binomial model requires extensive actual employee exercise behavior data and a number of complex assumptions including
expected volatility, risk-free interest rate, expected dividends, kurtosis, and skewness.