Cisco 2008 Annual Report Download - page 26
Download and view the complete annual report
Please find page 26 of the 2008 Cisco annual report below. You can navigate through the pages in the report by either clicking on the pages listed below, or by using the keyword search tool below to find specific information within the annual report.-
 1
1 -
2
-
3
-
4
-
5
-
6
-
7
-
8
-
9
-
10
-
11
-
12
-
13
-
14
-
15
-
 16
16 -
 17
17 -
 18
18 -
 19
19 -
 20
20 -
 21
21 -
 22
22 -
 23
23 -
 24
24 -
 25
25 -
 26
26 -
 27
27 -
 28
28 -
 29
29 -
 30
30 -
 31
31 -
 32
32 -
 33
33 -
 34
34 -
 35
35 -
 36
36 -
37
-
38
-
39
-
40
-
41
-
42
-
43
-
44
-
45
-
46
-
47
-
48
-
49
-
50
-
51
-
52
-
53
-
54
-
55
-
56
-
57
-
58
-
59
-
60
-
61
-
62
-
63
-
64
-
65
-
66
-
67
-
68
-
69
-
70
-
71
-
72
-
73
-
74
-
75
-
76
-
77
-
78
-
79
-
80
-
81
 |
 |
2008 Annual Report 31
Management’s Discussion and Analysis of Financial Condition and Results of Operations
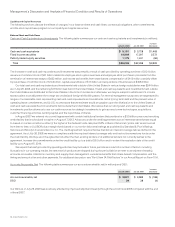
G&A Expenses G&A expenses for fiscal 2008 increased, compared with fiscal 2007, primarily due to increased headcount-related
expenses and increased information technology-related spending.
Effect of Foreign Currency Foreign currency fluctuations, net of hedging, increased total R&D, sales and marketing, and G&A expenses
by $332 million, or approximately 2.5%, in fiscal 2008 compared with fiscal 2007.
Headcount
Our headcount increased by 4,594 employees in fiscal 2008, reflecting the effects of our investments in sales and R&D described above
as well as increased investments in our service business and acquisitions. We expect our headcount to increase as we continue to invest
in our business. If we do not achieve the benefits anticipated from these investments, our operating results may be adversely affected.
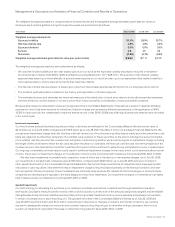
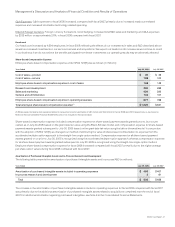
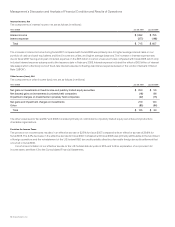
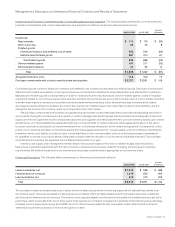
Share-Based Compensation Expense
Employee share-based compensation expense under SFAS 123(R) was as follows (in millions):
Years Ended July 26, 2008 July 28, 2007
Cost of sales—product $ 40 $ 39
Cost of sales—service 108 104
Employee share-based compensation expense in cost of sales 148 143
Research and development 295 289
Sales and marketing 434 392
General and administrative 148 107
Employee share-based compensation expense in operating expenses 877 788
Total employee share-based compensation expense(1) $ 1,025 $ 931
(1) Share-based compensation expense related to acquisitions and investments of $87 million and $34 million for fiscal 2008 and 2007, respectively, is disclosed in
Note 3 to the Consolidated Financial Statements and is not included in the above table.
Share-based compensation expense included compensation expense for share-based payment awards granted prior to, but not yet
vested, as of July 30, 2005 based on the grant date fair value using the Black-Scholes model, and compensation expense for share-based
payment awards granted subsequent to July 30, 2005 based on the grant date fair value using the lattice-binomial model. In conjunction
with the adoption of SFAS 123(R), we changed our method of attributing the value of share-based compensation to expense from the
accelerated multiple-option approach to the straight-line single-option method. Compensation expense for all share-based payment
awards granted on or prior to July 30, 2005 is recognized using the accelerated multiple-option approach, whereas compensation expense
for all share-based payment awards granted subsequent to July 30, 2005 is recognized using the straight-line single-option method.
Employee share-based compensation expense for fiscal 2008 increased compared with fiscal 2007 primarily due to the higher average
per share option values during fiscal 2008 compared with fiscal 2007.
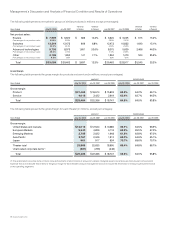
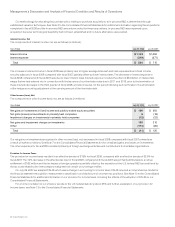
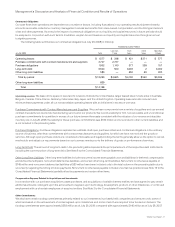
Amortization of Purchased Intangible Assets and In-Process Research and Development
The following table presents the amortization of purchased intangible assets and in-process R&D (in millions):
Years Ended July 26, 2008 July 28, 2007
Amortization of purchased intangible assets included in operating expenses $ 499 $ 407
In-process research and development 3 81
Total $ 502 $ 488
The increase in the amortization of purchased intangible assets included in operating expenses for fiscal 2008 compared with fiscal 2007
was primarily due to the additional amortization of purchased intangible assets related to acquisitions completed near the end of fiscal
2007. For additional information regarding purchased intangibles, see Note 4 to the Consolidated Financial Statements.