Cisco 2008 Annual Report Download - page 21
Download and view the complete annual report
Please find page 21 of the 2008 Cisco annual report below. You can navigate through the pages in the report by either clicking on the pages listed below, or by using the keyword search tool below to find specific information within the annual report.-
 1
1 -
2
-
3
-
4
-
5
-
6
-
7
-
8
-
9
-
10
-
 11
11 -
 12
12 -
 13
13 -
 14
14 -
 15
15 -
 16
16 -
 17
17 -
 18
18 -
 19
19 -
 20
20 -
 21
21 -
 22
22 -
 23
23 -
 24
24 -
 25
25 -
 26
26 -
 27
27 -
 28
28 -
 29
29 -
 30
30 -
 31
31 -
32
-
33
-
34
-
35
-
36
-
37
-
38
-
39
-
40
-
41
-
42
-
43
-
44
-
45
-
46
-
47
-
48
-
49
-
50
-
51
-
52
-
53
-
54
-
55
-
56
-
57
-
58
-
59
-
60
-
61
-
62
-
63
-
64
-
65
-
66
-
67
-
68
-
69
-
70
-
71
-
72
-
73
-
74
-
75
-
76
-
77
-
78
-
79
-
80
-
81
 |
 |
26 Cisco Systems, Inc.
Management’s Discussion and Analysis of Financial Condition and Results of Operations
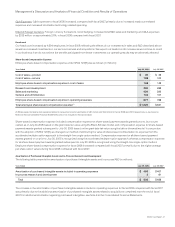
The following table presents net sales for groups of similar products (in millions, except percentages):
Years Ended July 28, 2007
Variance
in Dollars
Variance
in Percent July 28, 2007 July 29, 2006
Variance
in Dollars
Variance
in PercentJuly 26, 2008
Net product sales:
Routers $ 7,909 $ 6,920 $ 989 14.3% $ 6,920 $ 6,005 $ 915 15.2%
Percentage of net product sales 23.9% 23.5% 23.5% 25.1%
Switches 13,319 12,473 846 6.8% 12,473 10,833 1,640 15.1%
Percentage of net product sales 40.2% 42.3% 42.3% 45.3%
Advanced technologies 9,736 8,075 1,661 20.6% 8,075 5,609 2,466 44.0%
Percentage of net product sales 29.4% 27.4% 27.4% 23.5%
Other 2,135 1,994 141 7.1% 1,994 1,470 524 35.6%
Percentage of net product sales 6.5% 6.8% 6.8% 6.1%
Total $ 33,099 $ 29,462 $ 3,637 12.3% $ 29,462 $ 23,917 $ 5,545 23.2%
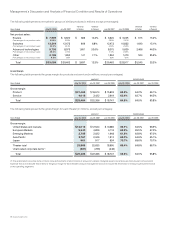
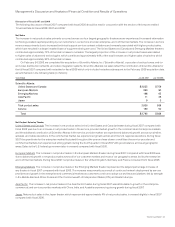
Gross Margin
The following table presents the gross margin for products and services (in millions, except percentages):
AMOUNT PERCENTAGE
Years Ended July 26, 2008 July 28, 2007 July 29, 2006 July 26, 2008 July 28, 2007 July 29, 2006
Gross margin:
Product $ 21,468 $ 18,914 $ 15,803 64.9% 64.2% 66.1%
Service 4,016 3,422 2,944 62.4% 62.7% 64.5%
Total $ 25,484 $ 22,336 $ 18,747 64.5% 64.0% 65.8%
The following table presents the gross margin for each theater (in millions, except percentages):
AMOUNT PERCENTAGE
Years Ended July 26, 2008 July 28, 2007 July 29, 2006 July 26, 2008 July 28, 2007 July 29, 2006
Gross margin:
United States and Canada $ 14,012 $ 12,524 $ 10,385 65.7% 64.6% 66.5%
European Markets 5,340 4,826 4,116 65.9% 65.5% 67.0%
Emerging Markets 2,785 2,022 1,648 61.8% 62.8% 67.0%
Asia Pacific 2,767 2,346 1,912 65.0% 64.6% 65.1%
Japan 961 917 934 70.7% 69.6% 70.7%
Theater total 25,865 22,635 18,995 65.4% 64.8% 66.7%
Unallocated corporate items(1) (381) (299) (248)
Total $ 25,484 $ 22,336 $ 18,747 64.5% 64.0% 65.8%
(1) The unallocated corporate items primarily include the effects of amortization of acquisition-related intangible assets and employee share-based compensation
expense. We do not allocate these items to the gross margin for each theater because management does not include the information in measuring the performance
of the operating segments.