Cisco 2008 Annual Report Download - page 69
Download and view the complete annual report
Please find page 69 of the 2008 Cisco annual report below. You can navigate through the pages in the report by either clicking on the pages listed below, or by using the keyword search tool below to find specific information within the annual report.-
 1
1 -
2
-
3
-
4
-
5
-
6
-
7
-
8
-
9
-
10
-
11
-
12
-
13
-
14
-
15
-
16
-
17
-
18
-
19
-
20
-
21
-
22
-
23
-
24
-
25
-
26
-
27
-
28
-
29
-
30
-
31
-
32
-
33
-
34
-
35
-
36
-
37
-
38
-
39
-
40
-
41
-
42
-
43
-
44
-
45
-
46
-
47
-
48
-
49
-
50
-
51
-
52
-
53
-
54
-
55
-
56
-
57
-
58
-
 59
59 -
 60
60 -
 61
61 -
 62
62 -
 63
63 -
 64
64 -
 65
65 -
 66
66 -
 67
67 -
 68
68 -
 69
69 -
 70
70 -
 71
71 -
 72
72 -
 73
73 -
 74
74 -
 75
75 -
 76
76 -
 77
77 -
 78
78 -
 79
79 -
80
-
81
 |
 |

74 Cisco Systems, Inc.
Notes to Consolidated Financial Statements
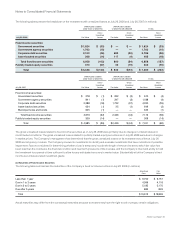
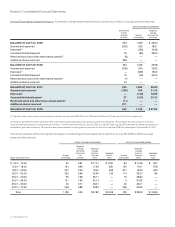
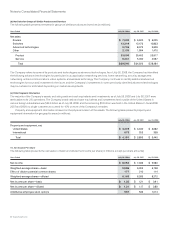
General Share-Based Award Information A summary of share-based award activity is as follows (in millions, except per-share amounts):
STOCK OPTIONS OUTSTANDING
Share-Based
Awards
Available
for Grant
Number
Outstanding
Weighted-
Average
Exercise Price
per Share
BALANCE AT JULY 30, 2005 223 1,436 $ 25.02
Granted and assumed (230) 230 18.21
Exercised(1) — (136) 10.08
Canceled/forfeited/expired 79 (84) 29.53
Restricted stock and other share-based awards(2) (6) — —
Additional shares reserved 398 — —
BALANCE AT JULY 29, 2006 464 1,446 25.08
Granted and assumed (206) 206 23.32
Exercised(1) — (309) 16.00
Canceled/forfeited/expired 19 (54) 34.04
Restricted stock and other share-based awards(2) (7) — —
Additional shares reserved 24 — —
BALANCE AT JULY 28, 2007 294 1,289 26.60
Granted and assumed (159) 159 31.12
Exercised(1) — (146) 18.50
Canceled/forfeited/expired 27 (103) 30.74
Restricted stock and other share-based awards(2) (11) — —
Additional shares reserved 211 — —
BALANCE AT JULY 26, 2008 362 1,199 $ 27.83
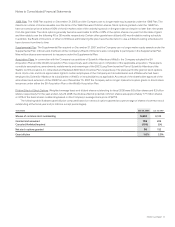
(1) The total pretax intrinsic value of stock options exercised during fiscal 2008, 2007, and 2006 was $1.6 billion, $3.1 billion and $1.3 billion, respectively.
(2) Amounts represent restricted stock and other share-based awards (excluding stock options) granted and assumed. The Company had total shares of restricted
stock and restricted stock units outstanding of 10 million, 11 million, and 6 million as of July 26, 2008, July 28, 2007, and July 29, 2006, respectively. Share-based awards
available for grant are reduced by 2.5 shares for each share awarded as stock grants or pursuant to stock units from the 2005 Plan subsequent to November 15, 2007.
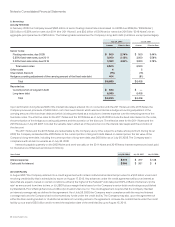
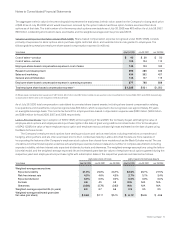
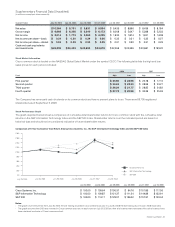
The following table summarizes significant ranges of outstanding and exercisable stock options as of July 26, 2008 (in millions, except
years and share prices):
STOCK OPTIONS OUTSTANDING STOCK OPTIONS EXERCISABLE
Range of Exercise Prices
Number
Outstanding
Weighted-
Average
Remaining
Contractual
Life
(in Years)
Weighted-
Average
Exercise
Price per
Share
Aggregate
Intrinsic
Value
Number
Exercisable
Weighted-
Average
Exercise
Price per
Share
Aggregate
Intrinsic
Value
$ 0.01 – 15.00 92 3.67 $ 11.21 $ 1,037 84 $ 11.28 $ 927
15.01 – 18.00 191 4.96 17.29 981 125 17.01 678
18.01 – 20.00 257 4.56 19.22 823 201 19.23 643
20.01 – 25.00 222 5.96 22.45 102 114 22.27 85
25.01 – 30.00 55 7.28 26.71 — 15 26.84 —
30.01 – 35.00 131 7.92 32.14 — 5 31.65 —
35.01 – 50.00 23 0.71 40.01 — 23 40.01 —
50.01 – 72.56 228 0.89 54.90 — 228 54.90 —
Total 1,199 4.53 $ 27.83 $ 2,943 795 $ 29.53 $ 2,333