Cisco 2008 Annual Report Download - page 59
Download and view the complete annual report
Please find page 59 of the 2008 Cisco annual report below. You can navigate through the pages in the report by either clicking on the pages listed below, or by using the keyword search tool below to find specific information within the annual report.-
 1
1 -
2
-
3
-
4
-
5
-
6
-
7
-
8
-
9
-
10
-
11
-
12
-
13
-
14
-
15
-
16
-
17
-
18
-
19
-
20
-
21
-
22
-
23
-
24
-
25
-
26
-
27
-
28
-
29
-
30
-
31
-
32
-
33
-
34
-
35
-
36
-
37
-
38
-
39
-
40
-
41
-
42
-
43
-
44
-
45
-
46
-
47
-
48
-
 49
49 -
 50
50 -
 51
51 -
 52
52 -
 53
53 -
 54
54 -
 55
55 -
 56
56 -
 57
57 -
 58
58 -
 59
59 -
 60
60 -
 61
61 -
 62
62 -
 63
63 -
 64
64 -
 65
65 -
 66
66 -
 67
67 -
 68
68 -
 69
69 -
70
-
71
-
72
-
73
-
74
-
75
-
76
-
77
-
78
-
79
-
80
-
81
 |
 |
64 Cisco Systems, Inc.
Notes to Consolidated Financial Statements
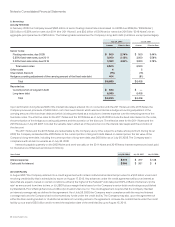
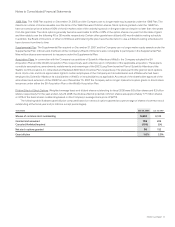
(d) Financing Guarantees
The Company provides financing guarantees, which are generally for various third-party financing arrangements extended to channel
partners and other customers. The Company could be called upon to make payment under these guarantees in the event of nonpayment
to the third party. As of July 26, 2008, the total maximum potential future payments related to these guarantees was approximately
$830 million, of which approximately $610 million was recorded as deferred revenue on the consolidated balance sheet in accordance
with revenue recognition policies and FIN 45.
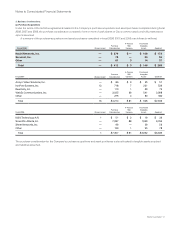
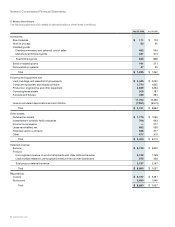
7. Investments
(a) Summary of Investments
The following tables summarize the Company’s investments (in millions):
Amortized
Cost
Gross
Unrealized
Gains
Gross
Unrealized
Losses
Fair
ValueJuly 26, 2008
Fixed income securities:
Government securities $ 7,249 $ 50 $ (33) $ 7,266
Government agency securities 5,815 34 (10) 5,839
Corporate debt securities 5,814 24 (96) 5,742
Asset-backed securities 1,035 5 (18) 1,022
Total fixed income securities 19,913 113 (157) 19,869
Publicly traded equity securities 860 391 (76) 1,175
Total $ 20,773 $ 504 $ (233) $ 21,044
Amortized
Cost
Gross
Unrealized
Gains
Gross
Unrealized
Losses
Fair
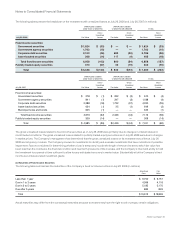
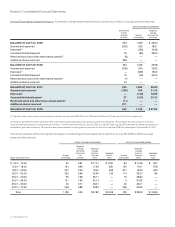
ValueJuly 28, 2007
Fixed income securities:
Government securities $ 4,557 $ 25 $ (4) $ 4,578
Government agency securities 2,362 4 (4) 2,362
Corporate debt securities 6,895 5 (55) 6,845
Asset-backed securities 1,870 2 (2) 1,870
Municipal notes and bonds 1,643 — (1) 1,642
Total fixed income securities 17,327 36 (66) 17,297
Publicly traded equity securities 901 354 (14) 1,241
Total $ 18,228 $ 390 $ (80) $ 18,538
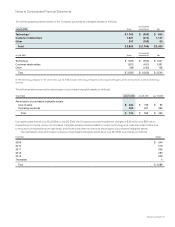
(b) Gains and Losses on Investments
The following table presents gross realized gains and losses related to the Company’s investments (in millions):
Years Ended July 26, 2008 July 28, 2007 July 29, 2006
Gross realized gains $ 306 $ 269 $ 141
Gross realized losses (197) (19) (88)
Total $ 109 $ 250 $ 53