Cisco 2008 Annual Report Download - page 31
Download and view the complete annual report
Please find page 31 of the 2008 Cisco annual report below. You can navigate through the pages in the report by either clicking on the pages listed below, or by using the keyword search tool below to find specific information within the annual report.-
 1
1 -
2
-
3
-
4
-
5
-
6
-
7
-
8
-
9
-
10
-
11
-
12
-
13
-
14
-
15
-
16
-
17
-
18
-
19
-
20
-
 21
21 -
 22
22 -
 23
23 -
 24
24 -
 25
25 -
 26
26 -
 27
27 -
 28
28 -
 29
29 -
 30
30 -
 31
31 -
 32
32 -
 33
33 -
 34
34 -
 35
35 -
 36
36 -
 37
37 -
 38
38 -
 39
39 -
 40
40 -
 41
41 -
42
-
43
-
44
-
45
-
46
-
47
-
48
-
49
-
50
-
51
-
52
-
53
-
54
-
55
-
56
-
57
-
58
-
59
-
60
-
61
-
62
-
63
-
64
-
65
-
66
-
67
-
68
-
69
-
70
-
71
-
72
-
73
-
74
-
75
-
76
-
77
-
78
-
79
-
80
-
81
 |
 |

36 Cisco Systems, Inc.
Management’s Discussion and Analysis of Financial Condition and Results of Operations
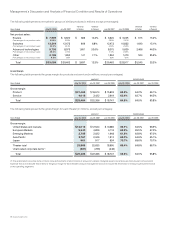
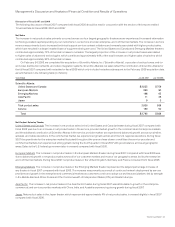
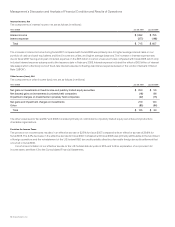
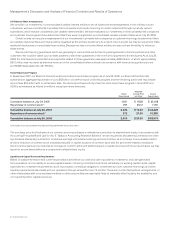
Interest Income, Net
The components of interest income, net, are as follows (in millions):
Years Ended July 28, 2007 July 29, 2006
Interest income $ 1,092 $ 755
Interest expense (377) (148)
Total $ 715 $ 607
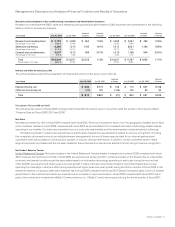
The increase in interest income during fiscal 2007 compared with fiscal 2006 was primarily due to higher average interest rates on our
portfolio of cash and cash equivalents and fixed income securities, and higher average balances. The increase in interest expense was
due to fiscal 2007 having a full year of interest expense on the $6.5 billion in senior unsecured notes compared with fiscal 2006, which only
included interest expense subsequent to the issuance date in February 2006. Interest expense included the effect of $6.0 billion of interest
rate swaps which effectively convert fixed-rate interest expense to floating-rate interest expense based on the London Interbank Offered
Rate (“LIBOR”).
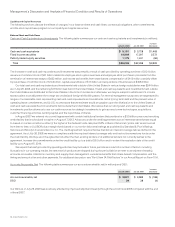
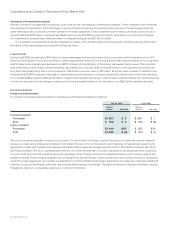
Other Income (Loss), Net
The components of other income (loss), net, are as follows (in millions):
Years Ended July 28, 2007 July 29, 2006
Net gains on investments in fixed income and publicly traded equity securities $ 250 $ 53
Net (losses) gains on investments in privately held companies (18) 86
Impairment charges on investments in privately held companies (22) (15)
Net gains and impairment charges on investments 210 124
Other (85) (94)
Total $ 125 $ 30
The other expenses for fiscal 2007 and 2006 consisted primarily of contributions of publicly traded equity securities and products to
charitable organizations.
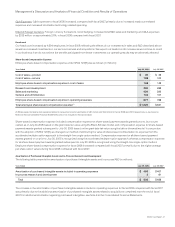
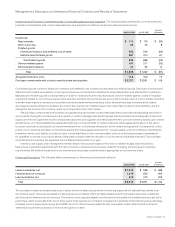
Provision for Income Taxes
The provision for income taxes resulted in an effective tax rate of 22.5% for fiscal 2007, compared with an effective tax rate of 26.9% for
fiscal 2006. The 4.4% decrease in the effective tax rate for fiscal 2007, compared with fiscal 2006, was primarily attributable to the tax impact
of foreign operations and the reinstatement of the U.S. federal R&D tax credit partially offset by a favorable foreign tax audit settlement that
occurred in fiscal 2006.
For a full reconciliation of our effective tax rate to the U.S. federal statutory rate of 35% and further explanation of our provision for
income taxes, see Note 13 to the Consolidated Financial Statements.