Cisco 2008 Annual Report Download - page 30
Download and view the complete annual report
Please find page 30 of the 2008 Cisco annual report below. You can navigate through the pages in the report by either clicking on the pages listed below, or by using the keyword search tool below to find specific information within the annual report.-
 1
1 -
2
-
3
-
4
-
5
-
6
-
7
-
8
-
9
-
10
-
11
-
12
-
13
-
14
-
15
-
16
-
17
-
18
-
19
-
 20
20 -
 21
21 -
 22
22 -
 23
23 -
 24
24 -
 25
25 -
 26
26 -
 27
27 -
 28
28 -
 29
29 -
 30
30 -
 31
31 -
 32
32 -
 33
33 -
 34
34 -
 35
35 -
 36
36 -
 37
37 -
 38
38 -
 39
39 -
 40
40 -
41
-
42
-
43
-
44
-
45
-
46
-
47
-
48
-
49
-
50
-
51
-
52
-
53
-
54
-
55
-
56
-
57
-
58
-
59
-
60
-
61
-
62
-
63
-
64
-
65
-
66
-
67
-
68
-
69
-
70
-
71
-
72
-
73
-
74
-
75
-
76
-
77
-
78
-
79
-
80
-
81
 |
 |
2008 Annual Report 35
Management’s Discussion and Analysis of Financial Condition and Results of Operations
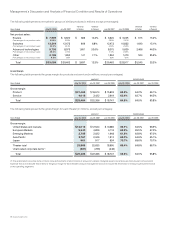
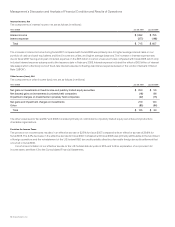
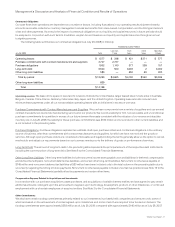
Product Gross Margin
The decrease in product gross margin percentage during fiscal 2007 compared with fiscal 2006 was due to the following factors:
• Changes in the mix of products sold decreased product gross margin percentage by 1.9%, with 1.7% of this decrease related to the
mix impact of higher net product sales from Scientific-Atlanta.
• Sales discounts, rebates, and product pricing decreased product gross margin percentage by 1.7%.
• Lower overall manufacturing costs related to lower component costs, value engineering and other manufacturing-related costs
increased product gross margin percentage by 0.9%.
• Higher shipment volume, net of certain variable costs, increased product gross margin percentage by 0.9%.
• Net effects of amortization of purchased intangible assets and share-based compensation expense decreased gross margin
percentage by 0.1%.
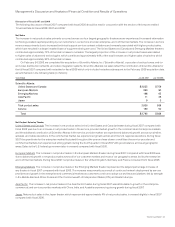
Service Gross Margin
Our service gross margin percentage for fiscal 2007 decreased from fiscal 2006, primarily due to strategic investments in headcount as
well as advanced services representing a higher proportion of total service revenue. Additionally, we have continued to invest in building
out our technical support and advanced services capabilities in the Emerging Markets theater.
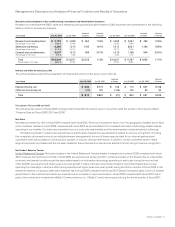
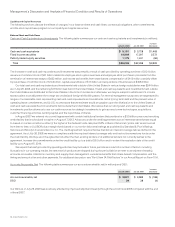
Research and Development, Sales and Marketing, and General and Administrative Expenses
R&D expenses increased for fiscal 2007 compared with fiscal 2006 primarily due to higher headcount-related expenses reflecting our
continued investment in R&D efforts for routers, switches, advanced technologies, and other product technologies. Scientific-Atlanta
contributed an additional $153 million of R&D expenses for fiscal 2007 compared with fiscal 2006. R&D expenses included employee
share-based compensation expense which decreased by $57 million compared with fiscal 2006.
Sales and marketing expenses for fiscal 2007 increased compared with fiscal 2006 primarily due to an increase in sales expenses
of $998 million. Sales expenses increased primarily due to an increase in headcount-related expenses. Scientific-Atlanta contributed an
additional $86 million of sales and marketing expenses for fiscal 2007 compared with fiscal 2006. Sales and marketing expenses for fiscal
2007 included employee share-based compensation expense which decreased by $35 million compared with fiscal 2006.
G&A expenses for fiscal 2007 increased compared with fiscal 2006 primarily due to increased headcount-related expenses and
approximately $65 million of real estate-related charges. Also, Scientific-Atlanta contributed an additional $54 million of G&A expenses for
fiscal 2007 compared with fiscal 2006.
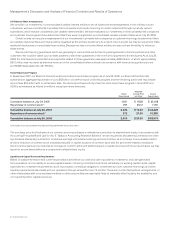
Headcount
Our headcount increased by 11,609 employees during fiscal 2007, reflecting the investment in R&D and sales described above and also
reflecting increases in investments in our service business; headcount related to our Juarez, Mexico manufacturing facility; and acquisitions.
Approximately 3,300 of the new employees were attributable to acquisitions we completed in fiscal 2007.
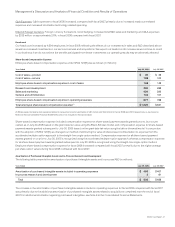
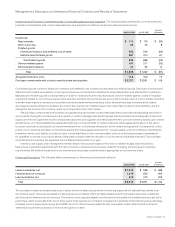
Share-Based Compensation Expense
In fiscal 2007, employee share-based compensation expense was $931 million, and share-based compensation expense related to
acquisitions and investments was $34 million. In fiscal 2006, employee share-based compensation expense was $1 billion and share-
based compensation expense related to acquisitions and investments was $87 million.
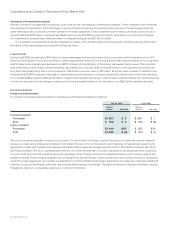
Amortization of Purchased Intangible Assets and In-Process Research and Development
Amortization of purchased intangible assets included in operating expenses was $407 million in fiscal 2007, compared with $393 million
in fiscal 2006. The increase in the amortization of purchased intangible assets included in operating expenses in fiscal 2007 compared
with fiscal 2006 was primarily due to the additional amortization of purchased intangible assets related to our acquisitions of Scientific-
Atlanta and WebEx, partially offset by an impairment charge of $69 million in fiscal 2006. For additional information regarding purchased
intangibles, see Note 4 to the Consolidated Financial Statements.
We recorded in-process R&D of $81 million in fiscal 2007 in connection with the purchase acquisitions completed. The total estimated
cost to complete the technology at the time of these acquisitions was $22 million and the risk-adjusted discount rates for the in-process
R&D recorded in connection with the acquisitions completed in fiscal 2007 ranged from 16% to 29%. We recorded in-process R&D of
$91 million in fiscal 2006 in connection with the purchase acquisitions completed. The total estimated cost to complete the technology at
the time of these acquisitions was $95 million and the risk-adjusted discount rates for the in-process R&D recorded in connection with the
acquisitions completed in fiscal 2006 ranged from 17% to 22%.