Cisco 2008 Annual Report Download - page 18
Download and view the complete annual report
Please find page 18 of the 2008 Cisco annual report below. You can navigate through the pages in the report by either clicking on the pages listed below, or by using the keyword search tool below to find specific information within the annual report.-
 1
1 -
2
-
3
-
4
-
5
-
6
-
7
-
 8
8 -
 9
9 -
 10
10 -
 11
11 -
 12
12 -
 13
13 -
 14
14 -
 15
15 -
 16
16 -
 17
17 -
 18
18 -
 19
19 -
 20
20 -
 21
21 -
 22
22 -
 23
23 -
 24
24 -
 25
25 -
 26
26 -
 27
27 -
 28
28 -
29
-
30
-
31
-
32
-
33
-
34
-
35
-
36
-
37
-
38
-
39
-
40
-
41
-
42
-
43
-
44
-
45
-
46
-
47
-
48
-
49
-
50
-
51
-
52
-
53
-
54
-
55
-
56
-
57
-
58
-
59
-
60
-
61
-
62
-
63
-
64
-
65
-
66
-
67
-
68
-
69
-
70
-
71
-
72
-
73
-
74
-
75
-
76
-
77
-
78
-
79
-
80
-
81
 |
 |

2008 Annual Report 23
Management’s Discussion and Analysis of Financial Condition and Results of Operations
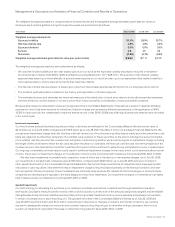
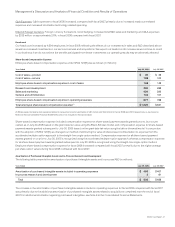
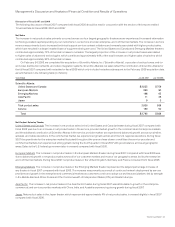
The weighted-average assumptions, using the lattice-binomial model and the weighted-average estimated grant date fair values of
employee stock options granted during the respective years are summarized as follows:
Years Ended July 26, 2008 July 28, 2007 July 29, 2006
Weighted-average assumptions:
Expected volatility 31.0% 26.0% 23.7%
Risk-free interest rate 4.3% 4.6% 4.3%
Expected dividend 0.0% 0.0% 0.0%
Kurtosis 4.6 4.5 4.3
Skewness (0.80) (0.79) (0.62)
Weighted-average estimated grant date fair value (per option share) $ 9.60 $ 7.11 $ 5.15
The weighted-average assumptions were determined as follows:
• We used the implied volatility for two-year traded options on our stock as the expected volatility assumption required in the lattice-
binomial model consistent with SFAS 123(R) and Staff Accounting Bulletin No. 107 (“SAB 107”). The selection of the implied volatility
approach was based upon the availability of actively traded options on our stock and also upon our assessment that implied volatility is
more representative of future stock price trends than historical volatility.
• The risk-free interest rate assumption is based upon observed interest rates appropriate for the term of our employee stock options.
• The dividend yield assumption is based on the history and expectation of dividend payouts.
• The estimated kurtosis and skewness are technical measures of the distribution of stock price returns, which affect expected employee
exercise behaviors, and are based on our stock price return history as well as consideration of various academic analyses.
Because share-based compensation expense recognized in the Consolidated Statements of Operations is based on awards ultimately
expected to vest, it has been reduced for forfeitures. If factors change and we employ different assumptions in the application of SFAS
123(R) in future periods, the compensation expense that we record under SFAS 123(R) may differ significantly from what we have recorded
in the current year.
Investment Impairments
Our fixed income and publicly traded equity securities, collectively, are reflected in the Consolidated Balance Sheets at a fair value of
$21.0 billion as of July 26, 2008, compared with $18.5 billion as of July 28, 2007. See Note 7 to the Consolidated Financial Statements. We
recognize an impairment charge when the declines in the fair values of our fixed income or publicly traded equity securities below their cost
basis are judged to be other-than-temporary. The ultimate value realized on these securities, to the extent unhedged, is subject to market
price volatility until they are sold. We consider various factors in determining whether we should recognize an impairment charge, including
the length of time and extent to which the fair value has been less than our cost basis, the financial condition and near-term prospects of the
investee, and our intent and ability to hold the investment for a period of time sufficient to allow for any anticipated recovery in market value.
Our ongoing consideration of these factors could result in additional impairment charges in the future, which could adversely affect our net
income. There were no impairment charges on investments in fixed income or publicly held companies during fiscal 2008, 2007, or 2006.
We also have investments in privately held companies, some of which are in the startup or development stages. As of July 26, 2008,
our investments in privately held companies were $706 million, compared with $643 million as of July 28, 2007, and were included in
other assets. See Note 5 to the Consolidated Financial Statements. We monitor these investments for impairment and make appropriate
reductions in carrying values if we determine that an impairment charge is required, based primarily on the financial condition and near-
term prospects of these companies. These investments are inherently risky because the markets for the technologies or products these
companies are developing are typically in the early stages and may never materialize. Our impairment charges on investments in privately
held companies were not material during fiscal 2008, 2007, or 2006.
Goodwill Impairments
Our methodology for allocating the purchase price relating to purchase acquisitions is determined through established valuation
techniques. Goodwill is measured as the excess of the cost of acquisition over the sum of the amounts assigned to tangible and identifiable
intangible assets acquired less liabilities assumed. We perform goodwill impairment tests on an annual basis and between annual tests
in certain circumstances for each reporting unit. The goodwill recorded in the Consolidated Balance Sheets as of July 26, 2008 and
July 28, 2007 was $12.4 billion and $12.1 billion, respectively. In response to changes in industry and market conditions, we could be
required to strategically realign our resources and consider restructuring, disposing of, or otherwise exiting businesses, which could
result in an impairment of goodwill. There was no impairment of goodwill in fiscal 2008, 2007, or 2006.