CarMax 2013 Annual Report Download - page 73
Download and view the complete annual report
Please find page 73 of the 2013 CarMax annual report below. You can navigate through the pages in the report by either clicking on the pages listed below, or by using the keyword search tool below to find specific information within the annual report.-
 1
1 -
2
-
3
-
4
-
5
-
6
-
7
-
8
-
9
-
10
-
11
-
12
-
13
-
14
-
15
-
16
-
17
-
18
-
19
-
20
-
21
-
22
-
23
-
24
-
25
-
26
-
27
-
28
-
29
-
30
-
31
-
32
-
33
-
34
-
35
-
36
-
37
-
38
-
39
-
40
-
41
-
42
-
43
-
44
-
45
-
46
-
47
-
48
-
49
-
50
-
51
-
52
-
53
-
54
-
55
-
56
-
57
-
58
-
59
-
60
-
61
-
62
-
 63
63 -
 64
64 -
 65
65 -
 66
66 -
 67
67 -
 68
68 -
 69
69 -
 70
70 -
 71
71 -
 72
72 -
 73
73 -
 74
74 -
 75
75 -
 76
76 -
 77
77 -
 78
78 -
 79
79 -
 80
80 -
 81
81 -
 82
82 -
 83
83 -
84
-
85
-
86
-
87
-
88
 |
 |
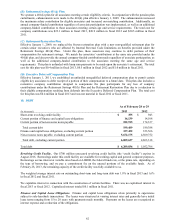
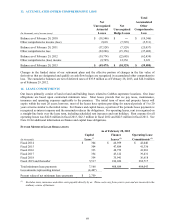
13. ACCUMULATED OTHER COMPREHENSIVE LOSS
Total
Net Accumulated
Unrecognized Net Other
Actuarial Unrecognized Comprehensive
(In thousands, net of income taxes) Losses Hedge Losses Loss
Balance as of February 28, 2010 $ (19,546) $ ― $ (19,546)
Other comprehensive income (loss) 2,018 (7,529) (5,511)
Balance as of February 28, 2011 (17,528) (7,529) (25,057)
Other comprehensive loss (22,246) (15,156) (37,402)
Balance as of February 29, 2012 (39,774) (22,685) (62,459)
Other comprehensive (loss) income (9,705) 12,356 2,651
Balance as of February 28, 2013 $ (49,479) $ (10,329) $ (59,808)
Changes in the funded status of our retirement plans and the effective portion of changes in the fair value of
derivatives that are designated and qualify as cash flow hedges are recognized in accumulated other comprehensive
loss. The cumulative balances are net of deferred taxes of $35.9 million as of February 28, 2013, and $24.0 million
as of February 29, 2012.
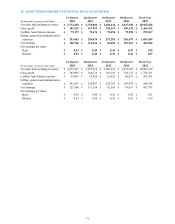
14. LEASE COMMITMENTS
Our leases primarily consist of land or land and building leases related to CarMax superstore locations. Our lease
obligations are based upon contractual minimum rates. Most leases provide that we pay taxes, maintenance,
insurance and operating expenses applicable to the premises. The initial term of most real property leases will
expire within the next 20 years; however, most of the leases have options providing for renewal periods of 5 to 20
years at terms similar to the initial terms. For finance and capital leases, a portion of the periodic lease payments is
recognized as interest expense and the remainder reduces the obligations. For operating leases, rent is recognized on
a straight-line basis over the lease term, including scheduled rent increases and rent holidays. Rent expense for all
operating leases was $42.8 million in fiscal 2013, $42.3 million in fiscal 2012 and $42.3 million in fiscal 2011. See
Note 10 for additional information on finance and capital lease obligations.
FUTURE MINIMUM LEASE OBLIGATIONS
As of February 28, 2013
Capital Finance Operating Lease
(In thousands) Lease (1) Leases (1) Commitments
(1)
Fiscal 2014 $ 304 $ 46,959 $ 42,040
Fiscal 2015 304 47,884 41,336
Fiscal 2016 333 48,752 41,901
Fiscal 2017 354 43,122 39,431
Fiscal 2018 354 35,941 36,618
Fiscal 2019 and thereafter 5,517 186,026 282,717
Total minimum lease payments 7,166 408,684 484,043
Less amounts re
p
resentin
g
interest
(
4,407
)
Present value of net minimum lease payments $ 2,759
(1) Excludes taxes, insurance and other costs payable directly by us. These costs vary from year to year and are incurred in the
ordinary course of business.
69