CarMax 2013 Annual Report Download - page 59
Download and view the complete annual report
Please find page 59 of the 2013 CarMax annual report below. You can navigate through the pages in the report by either clicking on the pages listed below, or by using the keyword search tool below to find specific information within the annual report.-
 1
1 -
2
-
3
-
4
-
5
-
6
-
7
-
8
-
9
-
10
-
11
-
12
-
13
-
14
-
15
-
16
-
17
-
18
-
19
-
20
-
21
-
22
-
23
-
24
-
25
-
26
-
27
-
28
-
29
-
30
-
31
-
32
-
33
-
34
-
35
-
36
-
37
-
38
-
39
-
40
-
41
-
42
-
43
-
44
-
45
-
46
-
47
-
48
-
 49
49 -
 50
50 -
 51
51 -
 52
52 -
 53
53 -
 54
54 -
 55
55 -
 56
56 -
 57
57 -
 58
58 -
 59
59 -
 60
60 -
 61
61 -
 62
62 -
 63
63 -
 64
64 -
 65
65 -
 66
66 -
 67
67 -
 68
68 -
 69
69 -
70
-
71
-
72
-
73
-
74
-
75
-
76
-
77
-
78
-
79
-
80
-
81
-
82
-
83
-
84
-
85
-
86
-
87
-
88
 |
 |
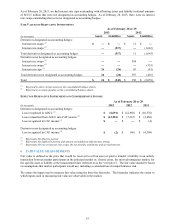
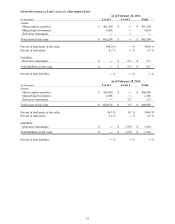
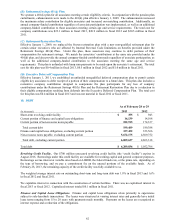
ITEMS MEASURED AT FAIR VALUE ON A RECURRING BASIS
As of February 28, 2013
(In thousands) Level 1 Level 2 Total
Assets:
Money market securities $ 461,260 $ ― $ 461,260
Mutual fund investments 4,024 ― 4,024
Derivative instruments ― ― ―
Total assets at fair value $ 465,284 $ ― $ 465,284
Percent of total assets at fair value 100.0 % ― % 100.0 %
Percent of total assets 4.7 % ― % 4.7 %
Liabilities:
Derivative instruments $ ― $ 517 $ 517
Total liabilities at fair value $ ― $ 517 $ 517
Percent of total liabilities ―% ― % ―%
As of February 29, 2012
(In thousands) Level 1 Level 2 Total
Assets:
Money market securities $ 458,090 $ ― $ 458,090
Mutual fund investments 2,586 ― 2,586
Derivative instruments ― 317 317
Total assets at fair value $ 460,676 $ 317 $ 460,993
Percent of total assets at fair value 99.9 % 0.1 % 100.0 %
Percent of total assets 5.5 % ― % 5.5 %
Liabilities:
Derivative instruments $ ― $ 1,978 $ 1,978
Total liabilities at fair value $ ― $ 1,978 $ 1,978
Percent of total liabilities ―% ― % ―%
55