CarMax 2013 Annual Report Download - page 64
Download and view the complete annual report
Please find page 64 of the 2013 CarMax annual report below. You can navigate through the pages in the report by either clicking on the pages listed below, or by using the keyword search tool below to find specific information within the annual report.-
 1
1 -
2
-
3
-
4
-
5
-
6
-
7
-
8
-
9
-
10
-
11
-
12
-
13
-
14
-
15
-
16
-
17
-
18
-
19
-
20
-
21
-
22
-
23
-
24
-
25
-
26
-
27
-
28
-
29
-
30
-
31
-
32
-
33
-
34
-
35
-
36
-
37
-
38
-
39
-
40
-
41
-
42
-
43
-
44
-
45
-
46
-
47
-
48
-
49
-
50
-
51
-
52
-
53
-
 54
54 -
 55
55 -
 56
56 -
 57
57 -
 58
58 -
 59
59 -
 60
60 -
 61
61 -
 62
62 -
 63
63 -
 64
64 -
 65
65 -
 66
66 -
 67
67 -
 68
68 -
 69
69 -
 70
70 -
 71
71 -
 72
72 -
 73
73 -
 74
74 -
75
-
76
-
77
-
78
-
79
-
80
-
81
-
82
-
83
-
84
-
85
-
86
-
87
-
88
 |
 |

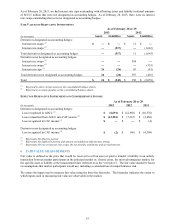
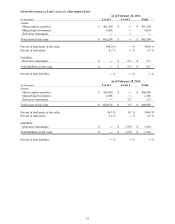
FAIR VALUE OF PLAN ASSETS AND FAIR VALUE HIERARCHY
As of February 28 or 29
(In thousands) 2013 2012
Cash and cash equivalents (Level 1) $ 255 $ 595
Mutual funds (Level 1):
Equity securities (1) 67,957 24,410
Equity securities – international (2) 13,536 4,078
Fixed income securities (3) 26,218 22,750
Collective funds (Level 2):
Equity securities (4) ― 36,803
Equity securities – international (5) ― 8,261
Investment receivables, net (Level 1) 2 ―
Total $ 107,968 $ 96,897
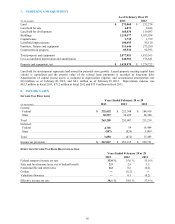
(1) Includes large-, mid- and small-cap companies primarily from diverse U.S. industries including bank, oil and gas, retail,
computer, pharmaceutical, and internet sectors; approximately 95% of securities relate to U.S. entities and 5% of securities
relate to non-U.S. entities as of February 28, 2013 (95% and 5%, respectively, as of February 29, 2012) .
(2) Consists of equity securities of primarily foreign corporations from diverse industries including bank, pharmaceutical, oil
and gas, food, telecommunication and insurance sectors; 100% of securities relate to non-U.S. entities as of
February 28, 2013 (100% relate to non-U.S. entities, as of February 29, 2012).
(3) Includes debt securities of U.S. and foreign governments, their agencies and corporations, and diverse investments in
mortgage-backed securities, banks and corporate bonds; approximately 85% of securities relate to U.S. entities and 15% of
securities relate to non-U.S. entities as of February 28, 2013 (70% and 30%, respectively, as of February 29, 2012).
(4) Includes pooled funds representing mutual funds that include large-, mid- and small-cap companies from diverse U.S.
industries including bank, internet and computer sectors; approximately 95% of securities relate to U.S. entities and 5% of
securities relate to non-U.S. entities as of February 29, 2012.
(5) Consists of pooled funds representing mutual funds that include equity securities of primarily foreign corporations from
diverse industries including bank, oil and gas and REIT sectors; approximately 90% of securities relate to non-U.S. entities
and 10% of securities relate to U.S. entities as of February 29, 2012.
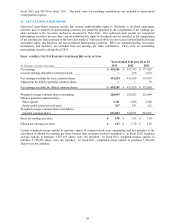
Funding Policy. For the pension plan, we contribute amounts sufficient to meet minimum funding requirements as
set forth in the employee benefit and tax laws, plus any additional amounts as we may determine to be appropriate.
We do not expect to make any contributions to the pension plan in fiscal 2014. For the non-funded restoration plan,
we contribute an amount equal to the benefit payments.
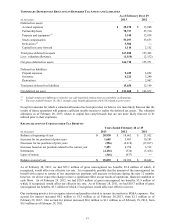
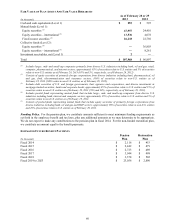
ESTIMATED FUTURE BENEFIT PAYMENTS
Pension Restoration
(In thousands) Plan Plan
Fiscal 2014 $ 2,116 $ 453
Fiscal 2015 $ 2,442 $ 479
Fiscal 2016 $ 2,723 $ 489
Fiscal 2017 $ 3,044 $ 498
Fiscal 2018 $ 3,378 $ 502
Fiscal 2019 to 2023 $ 23,056 $ 2,890
60