CarMax 2013 Annual Report Download - page 3
Download and view the complete annual report
Please find page 3 of the 2013 CarMax annual report below. You can navigate through the pages in the report by either clicking on the pages listed below, or by using the keyword search tool below to find specific information within the annual report.-
 1
1 -
 2
2 -
 3
3 -
 4
4 -
 5
5 -
 6
6 -
 7
7 -
 8
8 -
 9
9 -
 10
10 -
 11
11 -
 12
12 -
 13
13 -
 14
14 -
15
-
16
-
17
-
18
-
19
-
20
-
21
-
22
-
23
-
24
-
25
-
26
-
27
-
28
-
29
-
30
-
31
-
32
-
33
-
34
-
35
-
36
-
37
-
38
-
39
-
40
-
41
-
42
-
43
-
44
-
45
-
46
-
47
-
48
-
49
-
50
-
51
-
52
-
53
-
54
-
55
-
56
-
57
-
58
-
59
-
60
-
61
-
62
-
63
-
64
-
65
-
66
-
67
-
68
-
69
-
70
-
71
-
72
-
73
-
74
-
75
-
76
-
77
-
78
-
79
-
80
-
81
-
82
-
83
-
84
-
85
-
86
-
87
-
88
 |
 |
CarMax Fiscal 2013 1
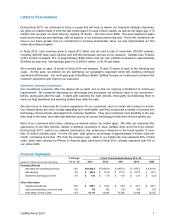
Letter to Shareholders
During fiscal 2013, we continued to focus on goals that will help us deliver our long-term strategic objectives;
we grew our market share in both the late model (age 0-6) used vehicle market, as well as the larger age 0-10
market; and we grew our store base by opening 10 stores – the most since 2008. We were pleased to again
post record revenues and earnings, with all aspects of our business performing well. Given the confidence we
have in our future growth and our commitment to increase shareholder value, we also implemented our first
share repurchase program.
In fiscal 2013, total revenues grew to nearly $11 billion and we sold a total of more than 780,000 vehicles,
including 448,000 retail used vehicles and 325,000 wholesale vehicles at our auctions. CarMax Auto Finance
(CAF) income increased 14% to approximately $300 million and our loan portfolio increased to approximately
$6 billion by year end. Net earnings grew 5% to $434.3 million, or $1.87 per share.
We currently plan to open 13 stores in fiscal 2014 and between 10 and 15 stores in each of the following two
years. At this pace, we believe we are optimizing our geographic expansion while still enabling continued
operational efficiencies. Our multi-year goal of Building a Better CarMax focuses on continuing to enhance the
customer experience and improve our execution.
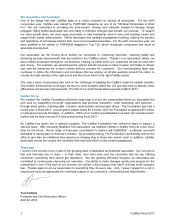
Unrivaled Customer Experience
Our exceptional consumer offer has always set us apart, but so has our ongoing commitment to continuous
improvement. By constantly improving our technology and processes, we enhance value to our consumers -
before, during and after the sale. It starts with selecting the right vehicles, thoroughly reconditioning them to
meet our high standards and standing behind them after the sale.
We also focus on improving the in-store experience for our customers, and our stores will continue to evolve.
Our newest stores are more visually appealing and comfortable, and they incorporate a variety of process and
technology enhancements developed from customer feedback. They give customers more flexibility in the way
they shop in the store, and offer high definition and touch screen technology to help them find the perfect car.
Most of our customers start online, utilizing our website and/or our mobile apps. We offer our customers the
opportunity to use their phones, tablets or desktop computers to shop CarMax when and how they choose.
During fiscal 2013, visits to our website continued to rise, achieving a milestone in the fourth quarter of more
than 10 million monthly visits. For the full year, visits grew to an average of approximately 9 million visits per
month, increasing more than 15% from the previous year. Visits to our mobile site now represent 20% of total
visits, while visits utilizing our iPhone or Android apps, launched in fiscal 2013, already represent over 6% of
our online traffic.
Financial Highlights
% Change Fiscal Years Ended February 28 or 29
(Dollars in millions except per share data) ‘13 vs. ‘12 2013 2012 2011 2010 2009
Operating Results
Net sales and operating revenues 10% $ 10,962.8 $10,003.6 $ 8,975.6 $ 7,470.2 $ 6,974.0
Net earnings 5% $ 434.3 $ 413.8 $ 377.5 $ 277.8 $ 55.2
Diluted net earnings per share 4% $ 1.87 $ 1.79 $ 1.65 $ 1.24 $ 0.25
Other Information
Capital expenditures 37% $ 235.7 $ 172.6 $ 76.6 $ 22.4 $ 185.7
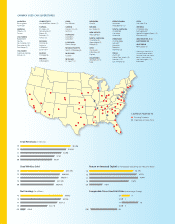
Used car superstores, at end of year 9% 118 108 103 100 100
Associates, at end of year 10% 18,111 16,460 15,565 13,439 13,035