CarMax 2013 Annual Report Download - page 28
Download and view the complete annual report
Please find page 28 of the 2013 CarMax annual report below. You can navigate through the pages in the report by either clicking on the pages listed below, or by using the keyword search tool below to find specific information within the annual report.-
 1
1 -
2
-
3
-
4
-
5
-
6
-
7
-
8
-
9
-
10
-
11
-
12
-
13
-
14
-
15
-
16
-
17
-
 18
18 -
 19
19 -
 20
20 -
 21
21 -
 22
22 -
 23
23 -
 24
24 -
 25
25 -
 26
26 -
 27
27 -
 28
28 -
 29
29 -
 30
30 -
 31
31 -
 32
32 -
 33
33 -
 34
34 -
 35
35 -
 36
36 -
 37
37 -
 38
38 -
39
-
40
-
41
-
42
-
43
-
44
-
45
-
46
-
47
-
48
-
49
-
50
-
51
-
52
-
53
-
54
-
55
-
56
-
57
-
58
-
59
-
60
-
61
-
62
-
63
-
64
-
65
-
66
-
67
-
68
-
69
-
70
-
71
-
72
-
73
-
74
-
75
-
76
-
77
-
78
-
79
-
80
-
81
-
82
-
83
-
84
-
85
-
86
-
87
-
88
 |
 |

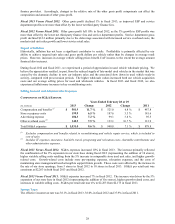
We evaluate the need to record valuation allowances that would reduce deferred tax assets to the amount that will
more likely than not be realized. When assessing the need for valuation allowances, we consider available
carrybacks, future reversals of existing temporary differences and future taxable income. Except for a valuation
allowance recorded for capital loss carryforwards that may not be utilized before their expiration, we believe that
our recorded deferred tax assets as of February 28, 2013, will more likely than not be realized. However, if a change
in circumstances results in a change in our ability to realize our deferred tax assets, our tax provision would be
affected in the period when the change in circumstances occurs.
In addition, the calculation of our tax liabilities involves dealing with uncertainties in the application of complex tax
regulations. We recognize potential liabilities for anticipated tax audit issues in the U.S. and other tax jurisdictions
based on our estimate of whether, and the extent to which, additional taxes will be due. If payments of these
amounts ultimately prove to be unnecessary, the reversal of the liabilities would result in tax benefits being
recognized in the period when we determine the liabilities are no longer necessary. If our estimate of tax liabilities
proves to be less than the ultimate assessment, a further charge to expense would result in the period of
determination.
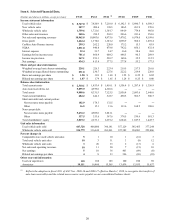
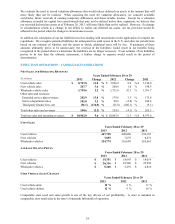
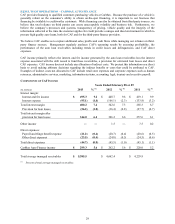
RESULTS OF OPERATIONS – CARMAX SALES OPERATIONS
NET SALES AND OPERATING REVENUES
Years Ended February 28 or 29
(In millions) 2013 Change 2012 Change 2011
Used vehicle sales $ 8,747.0 11.8 % $ 7,826.9 8.6 % $ 7,210.0
N
ew vehicle sales 207.7 3.6 % 200.6 1.0 % 198.5
Wholesale vehicle sales 1,759.6 2.2 % 1,721.6 32.3 % 1,301.7
Other sales and revenues:
Extended service plan revenues 202.9 13.0 % 179.6 3.3 % 173.8
Service department sales 101.8 3.2 % 98.6 (2.0) % 100.6
Third-party finance fees, net (56.1) (136.0) % (23.8) (160.1) % (9.1)
Total other sales and revenues 248.6 (2.3) % 254.5 (4.1) % 265.3
Total net sales and operating revenues $ 10,962.8 9.6 % $ 10,003.6 11.5 % $ 8,975.6
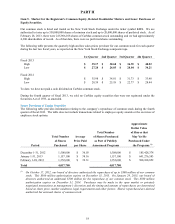
UNIT SALES
Years Ended February 28 or 29
2013 2012 2011
Used vehicles 447,728 408,080 396,181
N
ew vehicles 7,855 7,679 8,231
Wholesale vehicles 324,779 316,649 263,061
AVERAGE SELLING PRICES
Years Ended February 28 or 29
2013 2012 2011
Used vehicles $ 19,351 $ 18,995 $ 18,019
N
ew vehicles $ 26,316 $ 25,986 $ 23,989
Wholesale vehicles $5,268
$ 5,291 $ 4,816
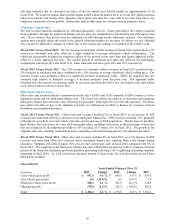
USED VEHICLE SALES CHANGES
Years Ended February 28 or 29
2013 2012 2011
Used vehicle units 10 % 3 % 11 %
Used vehicle dollars 12 % 9 % 16 %
Comparable store used unit sales growth is one of the key drivers of our profitability. A store is included in
comparable store retail sales in the store’s fourteenth full month of operation.
24