CarMax 2013 Annual Report Download - page 34
Download and view the complete annual report
Please find page 34 of the 2013 CarMax annual report below. You can navigate through the pages in the report by either clicking on the pages listed below, or by using the keyword search tool below to find specific information within the annual report.-
 1
1 -
2
-
3
-
4
-
5
-
6
-
7
-
8
-
9
-
10
-
11
-
12
-
13
-
14
-
15
-
16
-
17
-
18
-
19
-
20
-
21
-
22
-
23
-
 24
24 -
 25
25 -
 26
26 -
 27
27 -
 28
28 -
 29
29 -
 30
30 -
 31
31 -
 32
32 -
 33
33 -
 34
34 -
 35
35 -
 36
36 -
 37
37 -
 38
38 -
 39
39 -
 40
40 -
 41
41 -
 42
42 -
 43
43 -
 44
44 -
45
-
46
-
47
-
48
-
49
-
50
-
51
-
52
-
53
-
54
-
55
-
56
-
57
-
58
-
59
-
60
-
61
-
62
-
63
-
64
-
65
-
66
-
67
-
68
-
69
-
70
-
71
-
72
-
73
-
74
-
75
-
76
-
77
-
78
-
79
-
80
-
81
-
82
-
83
-
84
-
85
-
86
-
87
-
88
 |
 |

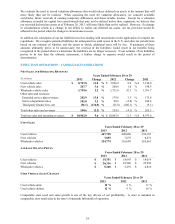
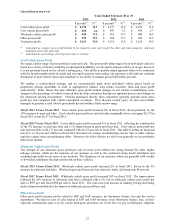
CAF ORIGINATION INFORMATION
Years Ended February 28 or 29 (1)
2013 2012 2011
N
et loans originated (in millions) $ 3,445.3 $ 2,842.9 $ 2,147.4
Vehicle units financed 179,525 152,468 120,183
Penetration rate (2) 39.4 % 36.7 %
29.7 %
Weighted average contract rate 7.9 % 8.8 %
8.7 %
Weighted average term (in months) 65.9 65.3 64.5
(1) All information relates to loans originated net of 3-day payoffs and vehicle returns.
(2) Vehicle units financed as a percentage of total retail units sold.
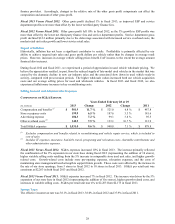
Fiscal 2013 Versus Fiscal 2012. CAF income increased 14% to $299.3 million compared with $262.2 million in
fiscal 2012, primarily reflecting the growth in managed receivables. Despite the growth in our receivables, direct
expenses decreased modestly as we benefited from operating efficiencies.
CAF’s average managed receivables increased 16% during fiscal 2013, driven by the growth in CAF origination
volume throughout fiscal 2012 and fiscal 2013. Origination volumes benefited from an increase in CAF’s loan
penetration, as we have transitioned back to our pre-recession origination strategy and reduced the volume of
finance contracts we were selling to third-party providers. Our decision to retain the loans that third parties had
been purchasing primarily reflected our confidence in our ability to economically fund these loans. This transition
was completed in January 2012. Originations also benefited from increased average retail selling prices, which
translated into an increase in the average amount financed, and from the growth in retail unit sales during fiscal 2012
and fiscal 2013. Additionally, historically low funding costs have allowed CAF to begin offering more compelling
credit offers. Positive customer response to these credit offers further bolstered CAF origination volumes in the
second half of fiscal 2013. See Note 4 for additional information on the credit quality of auto loan receivables.
Total interest margin, which reflects the spread between interest and fees charged to consumers and our funding
costs, was 7.4% of average managed receivables for fiscal 2013, similar to the 7.3% margin in fiscal 2012. For the
past several years, CAF has benefited from historically low funding costs in the asset-backed securitization market.
Rising interest rates or competitive pressure on consumer rates could result in compression in the interest margin on
new originations. We began to experience this compression in the second half of fiscal 2013 as we lowered rates in
response to customer demand, which resulted in lower interest margins on new originations. Changes in the interest
margin on new originations affect CAF income over time, as loans amortize within the portfolio of managed
receivables.
The provision for loan losses is the periodic expense of maintaining an adequate allowance. For fiscal 2013, the
provision for loan losses as a percentage of average managed receivables increased moderately to 1.0% compared to
0.8% in fiscal 2012. Low unit charge-offs and strong recovery rates continued to partially offset the effect of the
change in credit mix resulting from the transition in our origination strategy.
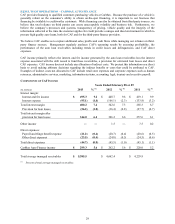
ALLOWANCE FOR LOAN LOSSES
Years Ended February 28 or 29
(In millions) 2013 % (1) 2012 % (1)
Balance as of beginning of year $43.3 0.9 $ 38.9 0.9
Charge-offs (103.1) (92.7)
Recoveries 60.9 60.7
Provision for loan losses 56.2 36.4
Balance as of end of year $57.3 1.0 $ 43.3 0.9
(1) Percent of total ending managed receivables as of the corresponding reporting date.
The allowance for loan losses represents an estimate of the amount of net losses inherent in our portfolio of managed
receivables as of the applicable reporting date and anticipated to occur during the following 12 months. The
allowance is primarily based on the credit quality of the underlying receivables, historical loss trends and forecasted
forward loss curves. We also take into account recent trends in delinquencies and losses, recovery rates and the
economic environment.
30