CarMax 2013 Annual Report Download - page 63
Download and view the complete annual report
Please find page 63 of the 2013 CarMax annual report below. You can navigate through the pages in the report by either clicking on the pages listed below, or by using the keyword search tool below to find specific information within the annual report.-
 1
1 -
2
-
3
-
4
-
5
-
6
-
7
-
8
-
9
-
10
-
11
-
12
-
13
-
14
-
15
-
16
-
17
-
18
-
19
-
20
-
21
-
22
-
23
-
24
-
25
-
26
-
27
-
28
-
29
-
30
-
31
-
32
-
33
-
34
-
35
-
36
-
37
-
38
-
39
-
40
-
41
-
42
-
43
-
44
-
45
-
46
-
47
-
48
-
49
-
50
-
51
-
52
-
 53
53 -
 54
54 -
 55
55 -
 56
56 -
 57
57 -
 58
58 -
 59
59 -
 60
60 -
 61
61 -
 62
62 -
 63
63 -
 64
64 -
 65
65 -
 66
66 -
 67
67 -
 68
68 -
 69
69 -
 70
70 -
 71
71 -
 72
72 -
 73
73 -
74
-
75
-
76
-
77
-
78
-
79
-
80
-
81
-
82
-
83
-
84
-
85
-
86
-
87
-
88
 |
 |

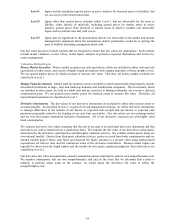
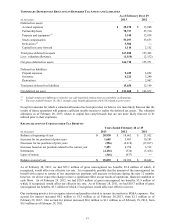
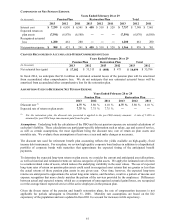
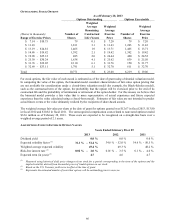
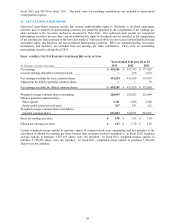
ASSUMPTIONS USED TO DETERMINE BENEFIT OBLIGATIONS
As of February 28 or 29
Pension Plan Restoration Plan
2013 2012 2013 2012
Discount rate (1) 4.30 % 4.75 % 4.30 % 4.75 %
(1) For the restoration plan, the discount rate presented is applied to the pre-2004 annuity amounts. A rate of 4.50% is
assumed for the post-2004 lump sum amounts paid from the plan for fiscal 2013. For prior years, the presumed lump sum
rate was 5.00%.
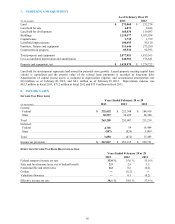
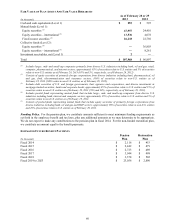
Plan Assets. Our pension plan assets are held in trust and management sets the investment policies and strategies.
Long-term strategic investment objectives include asset preservation and appropriately balancing risk and return.
We oversee the investment allocation process, which includes selecting investment managers, setting long-term
strategic targets and monitoring asset allocations and performance. Target allocations for plan assets are guidelines,
not limitations, and occasionally plan fiduciaries may approve allocations above or below the targets. We target
allocating 75% of plan assets to equity and equity-related instruments and 25% to fixed income securities. Equity
securities are currently composed of mutual funds that include highly diversified investments in large-, mid- and
small-cap companies located in the United States and internationally. As of February 29, 2012, the equity-related
instruments consisted of collective funds that were public investment vehicles with the underlying assets
representing mutual funds that include equity securities of highly diversified large-, mid-, small-cap companies
located in the United States and internationally. The fixed income securities are currently composed of mutual
funds that include investments in debt securities, mortgage-backed securities, corporate bonds and other debt
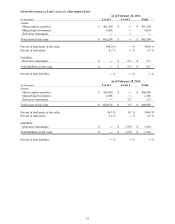
obligations primarily in the United States. We do not expect any plan assets to be returned to us during fiscal 2014.
The fair values of the plan’s assets are provided by the plan’s trustee and the investment managers. Within the fair
value hierarchy (see Note 6), cash and cash equivalents and the mutual funds are classified as Level 1 as quoted
active market prices for identical assets are used to measure fair value. The collective funds were public investment
vehicles valued using a net asset value (“NAV”) provided by the plan’s trustee as a practical expedient for
measuring the fair value. The NAV was based on the underlying net assets owned by the fund divided by the
number of shares outstanding. The NAV’s unit price was quoted on a private market that was not active. However,
the NAV was based on the fair value of the underlying securities within the fund, which were traded on an active
market and valued at the closing price reported on the active market on which those individual securities were
traded. As such, the collective funds were classified as Level 2. During fiscal 2013, collective funds totaling
$45.9 million were sold with the proceeds used to invest in Level 1 mutual funds as the investment strategy was
changed to a passive, index fund investment strategy from an actively managed portfolio.
59