CarMax 2013 Annual Report Download - page 36
Download and view the complete annual report
Please find page 36 of the 2013 CarMax annual report below. You can navigate through the pages in the report by either clicking on the pages listed below, or by using the keyword search tool below to find specific information within the annual report.-
 1
1 -
2
-
3
-
4
-
5
-
6
-
7
-
8
-
9
-
10
-
11
-
12
-
13
-
14
-
15
-
16
-
17
-
18
-
19
-
20
-
21
-
22
-
23
-
24
-
25
-
 26
26 -
 27
27 -
 28
28 -
 29
29 -
 30
30 -
 31
31 -
 32
32 -
 33
33 -
 34
34 -
 35
35 -
 36
36 -
 37
37 -
 38
38 -
 39
39 -
 40
40 -
 41
41 -
 42
42 -
 43
43 -
 44
44 -
 45
45 -
 46
46 -
47
-
48
-
49
-
50
-
51
-
52
-
53
-
54
-
55
-
56
-
57
-
58
-
59
-
60
-
61
-
62
-
63
-
64
-
65
-
66
-
67
-
68
-
69
-
70
-
71
-
72
-
73
-
74
-
75
-
76
-
77
-
78
-
79
-
80
-
81
-
82
-
83
-
84
-
85
-
86
-
87
-
88
 |
 |

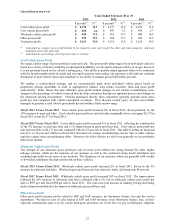
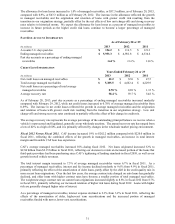
The provision for loan losses increased modestly to 0.8% of average managed receivables, or $36.4 million, in
fiscal 2012 from 0.7% or $27.7 million, in fiscal 2011. The increase in the provision primarily reflected the
cumulative effect of the origination and retention of loans with higher risk, partly offset by favorable loss experience
in fiscal 2012.
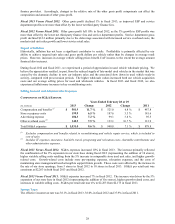
FISCAL 2014 PLANNED SUPERSTORE OPENINGS
Location Television Market Market Status Planned Opening Date
Harrisonburg, Virginia (1) Harrisonburg New Q1 Fiscal 2014
Columbus, Georgia (2) Columbus New Q1 Fiscal 2014
Savannah, Georgia Savannah New Q1 Fiscal 2014
Katy, Texas Houston Existing Q2 Fiscal 2014
Fairfield, California Sacramento Existing Q2 Fiscal 2014
Jackson, Tennessee Jackson New Q3 Fiscal 2014
Brandywine, Maryland Washington/Baltimore Existing Q3 Fiscal 2014
St. Louis, Missouri St. Louis New Q3 Fiscal 2014
St. Peters, Missouri St. Louis New Q4 Fiscal 2014
N
ewark, Delaware Philadelphia New Q4 Fiscal 2014
King of Prussia, Pennsylvania Philadelphia New Q4 Fiscal 2014
Frederick, Maryland Washington/Baltimore Existing Q4 Fiscal 2014
Elk Grove, California Sacramento Existing Q4 Fiscal 2014
(1) Opened in March 2013.
(2) Opened in April 2013.
Normal, permitting or other scheduling delays could shift the opening dates of any of these stores into a later period.
We estimate capital expenditures will total approximately $300 million in fiscal 2014. We currently plan to open
between 10 and 15 superstores in each of the following 2 fiscal years.
RECENT ACCOUNTING PRONOUNCEMENTS
See Note 2(Y) for information on recent accounting pronouncements applicable to CarMax.
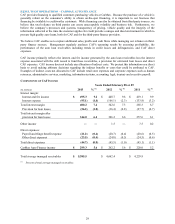
FINANCIAL CONDITION
Liquidity and Capital Resources
Our primary ongoing cash requirements are to fund our existing operations, new store expansion (including capital
expenditures and inventory purchases) and CAF, our finance operation. Our primary ongoing sources of liquidity
include existing cash balances, funds provided by operations, proceeds from securitization transactions or other
funding arrangements, and borrowings under our revolving credit facility.
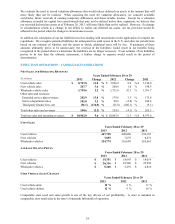
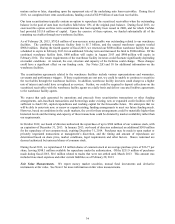
Operating Activities. Net cash used in operating activities totaled $778.4 million in fiscal 2013, $62.2 million in
fiscal 2012 and $6.8 million in fiscal 2011. These amounts included increases in auto loan receivables of
$992.2 million, $675.7 million and $304.7 million, respectively. The majority of the increases in auto loan
receivables are accompanied by increases in non-recourse notes payable, which are reflected as cash provided by
financing activities.
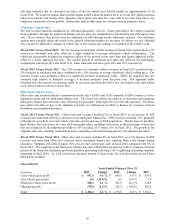
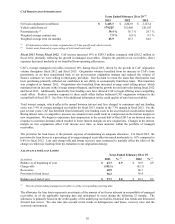
Inventory totaled $1.52 billion as of the end of fiscal 2013, up 39% versus $1.09 billion as of the end of fiscal 2012.
The increase reflected a 40% increase in used vehicle inventories, which was primarily attributable to a 35%
increase in used vehicles in inventory. The additional used vehicle units supported the ten stores opened during
fiscal 2013 and our comparable store sales growth. In addition, during the second half of fiscal 2013 we built
inventories at a higher rate than in recent years to better position ourselves for seasonal sales opportunities.
Inventory totaled $1.09 billion as of the end of fiscal 2012, up 4% versus $1.05 billion as of the end of fiscal 2011.
During fiscal 2012, used vehicle inventories increased 7%, including a 6% increase in used vehicles that largely
supported the opening of five new used car superstores. The increase in used inventories was partially offset by a
reduction in new vehicle inventory.
32