CarMax 2013 Annual Report Download - page 23
Download and view the complete annual report
Please find page 23 of the 2013 CarMax annual report below. You can navigate through the pages in the report by either clicking on the pages listed below, or by using the keyword search tool below to find specific information within the annual report.-
 1
1 -
2
-
3
-
4
-
5
-
6
-
7
-
8
-
9
-
10
-
11
-
12
-
 13
13 -
 14
14 -
 15
15 -
 16
16 -
 17
17 -
 18
18 -
 19
19 -
 20
20 -
 21
21 -
 22
22 -
 23
23 -
 24
24 -
 25
25 -
 26
26 -
 27
27 -
 28
28 -
 29
29 -
 30
30 -
 31
31 -
 32
32 -
 33
33 -
34
-
35
-
36
-
37
-
38
-
39
-
40
-
41
-
42
-
43
-
44
-
45
-
46
-
47
-
48
-
49
-
50
-
51
-
52
-
53
-
54
-
55
-
56
-
57
-
58
-
59
-
60
-
61
-
62
-
63
-
64
-
65
-
66
-
67
-
68
-
69
-
70
-
71
-
72
-
73
-
74
-
75
-
76
-
77
-
78
-
79
-
80
-
81
-
82
-
83
-
84
-
85
-
86
-
87
-
88
 |
 |
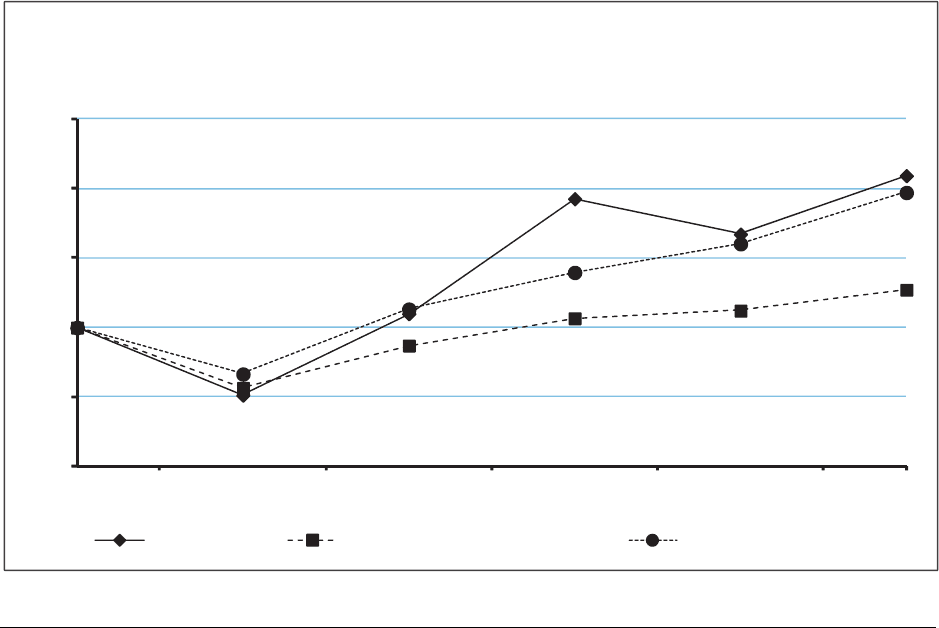
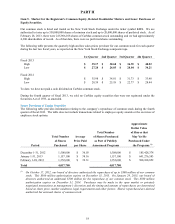
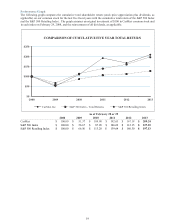
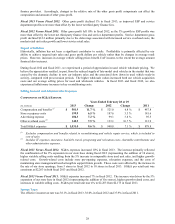
Performance Graph
The following graph compares the cumulative total shareholder return (stock price appreciation plus dividends, as
applicable) on our common stock for the last five fiscal years with the cumulative total return of the S&P 500 Index
and the S&P 500 Retailing Index. The graph assumes an original investment of $100 in CarMax common stock and
in each index on February 29, 2008, and the reinvestment of all dividends, as applicable.
As of February 28 or 29
2008 2009 2010 2011 2012 2013
CarMax $ 100.00 $ 51.37 $ 109.98 $ 192.65 $ 167.18 $ 209.24
$0
$50
$100
$150
$200
$250
200820092010201120122013
COMPARISON OF CUMULATIVE FIVE YEAR TOTAL RETURN
Ca rMax Inc S&P 500 Index - Total Returns S&P 500 Retailing Index
S&P 500 Index $ 100.00 $ 56.67 $ 87.05 $ 106.69 $ 112.15 $ 127.23
S&P 500 Retailing Index $ 100.00 $ 66.56 $ 113.28 $ 139.64 $ 160.30 $ 197.13
19