CarMax 2013 Annual Report Download - page 71
Download and view the complete annual report
Please find page 71 of the 2013 CarMax annual report below. You can navigate through the pages in the report by either clicking on the pages listed below, or by using the keyword search tool below to find specific information within the annual report.-
 1
1 -
2
-
3
-
4
-
5
-
6
-
7
-
8
-
9
-
10
-
11
-
12
-
13
-
14
-
15
-
16
-
17
-
18
-
19
-
20
-
21
-
22
-
23
-
24
-
25
-
26
-
27
-
28
-
29
-
30
-
31
-
32
-
33
-
34
-
35
-
36
-
37
-
38
-
39
-
40
-
41
-
42
-
43
-
44
-
45
-
46
-
47
-
48
-
49
-
50
-
51
-
52
-
53
-
54
-
55
-
56
-
57
-
58
-
59
-
60
-
 61
61 -
 62
62 -
 63
63 -
 64
64 -
 65
65 -
 66
66 -
 67
67 -
 68
68 -
 69
69 -
 70
70 -
 71
71 -
 72
72 -
 73
73 -
 74
74 -
 75
75 -
 76
76 -
 77
77 -
 78
78 -
 79
79 -
 80
80 -
 81
81 -
82
-
83
-
84
-
85
-
86
-
87
-
88
 |
 |

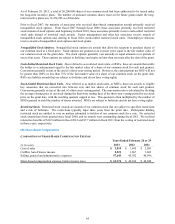
CASH-SETTLED RESTRICTED STOCK UNIT ACTIVITY
Weighted
Average
Number of
Grant Date
(Units in thousands) Units
Fair Value
Outstanding as of February 29, 2012 1,915 $ 21.76
Stock units granted 644 $ 31.76
Stock units vested and converted (786) $ 11.67
Stock units cancelled (122) $ 29.30
Outstanding as of February 28, 2013 1,651 $ 29.90
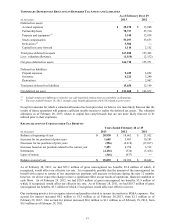
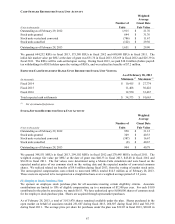
We granted 644,232 RSUs in fiscal 2013, 575,380 RSUs in fiscal 2012 and 688,880 RSUs in fiscal 2011. The
initial fair market value per RSU at the date of grant was $31.76 in fiscal 2013, $32.69 in fiscal 2012 and $25.39 in
fiscal 2011. The RSUs will be cash-settled upon vesting. During fiscal 2013, we paid $18.0 million (before payroll
tax withholdings) to RSU holders upon the vesting of RSUs, and we realized tax benefits of $7.2 million.
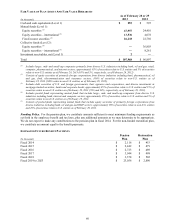
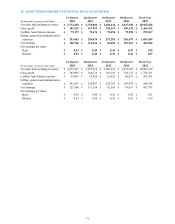
EXPECTED CASH SETTLEMENT RANGE UPON RESTRICTED STOCK UNIT VESTING
As of February 28, 2013
(In thousands) Minimum (1) Maximum (1)
Fiscal 2014 $ 10,415 $ 27,774
Fiscal 2015 11,408 30,422
Fiscal 2016 12,550 33,467
Total expected cash settlements $ 34,373 $ 91,663
(1) Net of estimated forfeitures.
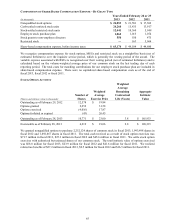
STOCK-SETTLED RESTRICTED STOCK UNIT ACTIVITY
Weighted
Average
Number of Grant Date
(Units in thousands) Units
Fair Value
Outstanding as of February 29, 2012 950 $ 31.12
Stock units granted 349 $ 40.33
Stock units vested and converted (387) $ 16.67
Stock units cancelled (8) $ 40.67
Outstanding as of February 28, 2013 904 $ 40.78
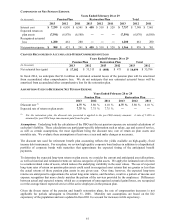
We granted 348,551 MSUs in fiscal 2013, 299,102 MSUs in fiscal 2012 and 278,445 MSUs in fiscal 2011. The
weighted average fair value per MSU at the date of grant was $40.33 in fiscal 2013, $45.48 in fiscal 2012 and
$36.28 in fiscal 2011. The fair values were determined using a Monte-Carlo simulation and were based on the
expected market price of our common stock on the vesting date and the expected number of converted common
shares. We realized related tax benefits of $9.6 million during fiscal 2013, from the vesting of market stock units.
The unrecognized compensation costs related to nonvested MSUs totaled $14.3 million as of February 28, 2013.
These costs are expected to be recognized on a straight-line basis over a weighted average period of 1.2 years.
(E) Employee Stock Purchase Plan
We sponsor an employee stock purchase plan for all associates meeting certain eligibility criteria. Associate
contributions are limited to 10% of eligible compensation, up to a maximum of $7,500 per year. For each $1.00
contributed to the plan by associates, we match $0.15. We have authorized up to 8,000,000 shares of common stock
for the employee stock purchase plan. Shares are acquired through open-market purchases.
As of February 28, 2013, a total of 3,913,470 shares remained available under the plan. Shares purchased in the
open market on behalf of associates totaled 251,667 during fiscal 2013, 260,927 during fiscal 2012 and 301,195
during fiscal 2011. The average price per share for purchases under the plan was $32.05 in fiscal 2013, $30.02 in
67