CarMax 2013 Annual Report Download - page 60
Download and view the complete annual report
Please find page 60 of the 2013 CarMax annual report below. You can navigate through the pages in the report by either clicking on the pages listed below, or by using the keyword search tool below to find specific information within the annual report.
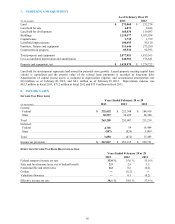
7. PROPERTY AND EQUIPMENT
As of February 28 or 29
(In thousands) 2013 2012
Land $ 275,060 $ 232,274
Land held for sale 4,872 8,446
Land held for development 168,830 119,087
Buildings 1,119,577 1,033,034
Capital leases 1,739 1,739
Leasehold improvements 106,695 95,110
Furniture, fixtures and equipment 311,646 273,280
Construction in progress 89,532 92,393
Total property and equipment 2,077,951 1,855,363
Less accumulated depreciation and amortization 648,981 576,641
Property and equipment, net $ 1,428,970 $ 1,278,722
Land held for development represents land owned for potential store growth. Leased property meeting capital lease
criteria is capitalized and the present value of the related lease payments is recorded as long-term debt.
Amortization of capital leased assets is included in depreciation expense, and accumulated amortization was
$0.2 million as of February 28, 2013, and $0.1 million as of February 29, 2012. Depreciation expense was
$82.3 million in fiscal 2013, $75.2 million in fiscal 2012 and $73.9 million in fiscal 2011.
8. INCOME TAXES
INCOME TAX PROVISION
Years Ended February 28 or 29
(In thousands) 2013 2012 2011
Current:
Federal $ 232,652 $ 223,548 $ 184,919
State 30,557 30,439 28,300
Total 263,209 253,987 213,219
Deferred:
Federal 4,705 54 16,484
State (847) (926) 1,009
Total 3,858 (872) 17,493
Income tax provision $ 267,067 $ 253,115 $ 230,711
EFFECTIVE INCOME TAX RATE RECONCILIATION
Years Ended February 28 or 29
2013 2012 2011
Federal statutory income tax rate 35.0 % 35.0 % 35.0 %
State and local income taxes, net of federal benefit 2.9 2.9 3.3
N
ondeductible and other items 0.2 0.2 (0.2)
Credits
― (0.2) ―
Valuation allowance ― 0.1 (0.2)
Effective income tax rate 38.1 % 38.0 % 37.9 %
56


