CarMax 2013 Annual Report Download - page 46
Download and view the complete annual report
Please find page 46 of the 2013 CarMax annual report below. You can navigate through the pages in the report by either clicking on the pages listed below, or by using the keyword search tool below to find specific information within the annual report.-
 1
1 -
2
-
3
-
4
-
5
-
6
-
7
-
8
-
9
-
10
-
11
-
12
-
13
-
14
-
15
-
16
-
17
-
18
-
19
-
20
-
21
-
22
-
23
-
24
-
25
-
26
-
27
-
28
-
29
-
30
-
31
-
32
-
33
-
34
-
35
-
 36
36 -
 37
37 -
 38
38 -
 39
39 -
 40
40 -
 41
41 -
 42
42 -
 43
43 -
 44
44 -
 45
45 -
 46
46 -
 47
47 -
 48
48 -
 49
49 -
 50
50 -
 51
51 -
 52
52 -
 53
53 -
 54
54 -
 55
55 -
 56
56 -
57
-
58
-
59
-
60
-
61
-
62
-
63
-
64
-
65
-
66
-
67
-
68
-
69
-
70
-
71
-
72
-
73
-
74
-
75
-
76
-
77
-
78
-
79
-
80
-
81
-
82
-
83
-
84
-
85
-
86
-
87
-
88
 |
 |

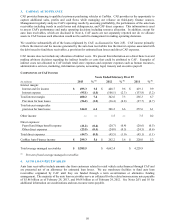
CONSOLIDATED STATEMENTS OF CASH FLOWS
See accompanying notes to consolidated financial statements.
Years Ended February 28 or 29
(In thousands) 2013 2012 2011
OPERATING ACTIVITIES:
Net earnings $ 434,284 $ 413,795 $ 377,495
Adjustments to reconcile net earnings to net cash
used in operating activities:
Depreciation and amortization 95,283 82,812 76,321
Share-based compensation expense 62,112 48,089 43,606
Provision for loan losses 56,168 36,439 27,749
Loss on disposition of assets 1,995 2,569 1,143
Deferred income tax provision (benefit) 3,858 (872) 17,493
(Gain on) impairment of long-lived assets held for sale (50) 248 ―
Net (increase) decrease in:
Accounts receivable, net (5,527) 33,163 (40,538)
Retained interest in securitized receivables ― ― 43,746
Inventory (425,221) (43,115) (206,344)
Other current assets (3,252) 15,919 (27,403)
Auto loan receivables, net (992,239) (675,711) (304,729)
Other assets (1,722) (6,986) (7,173)
Net (decrease) increase in:
Accounts payable, accrued expenses and other current
liabilities and accrued income taxes (575) 43,138 (8,802)
Other liabilities (3,555) (11,652) 678
NET CASH USED IN OPERATING ACTIVITIES (778,441) (62,164) (6,758)
INVESTING ACTIVITIES:
Capital expenditures (235,707) (172,608) (76,572)
(Increase) decrease in restricted cash from collections on
auto loan receivables (19,973) (43,262) 1,556
Increase in restricted cash in reserve accounts (13,385) (12,364) (12,631)
Release of restricted cash from reserve accounts 17,368 12,096 11,434
(Purchases) sales of money market securities, net (2,139) (678) 4,001
Purchases of investments available-for-sale (31,756) (2,638) ―
Sales of investments available-for-sale 30,318 52 ―
NET CASH USED IN INVESTING ACTIVITIES (255,274) (219,402) (72,212)
FINANCING ACTIVITIES:
(Decrease) increase in short-term debt, net (588) (59) 119
Issuances of long-term debt ― ― 243,300
Payments on long-term debt ― ― (364,900)
Payments on finance and capital lease obligations (14,083) (12,560) (11,145)
Issuances of non-recourse notes payable 5,851,000 5,130,000 3,348,000
Payments on non-recourse notes payable (4,679,999) (4,459,572) (3,160,749)
Repurchase and retirement of common stock (203,405) ― ―
Equity issuances, net 63,396 15,577 38,277
Excess tax benefits from share-based payment arrangements 24,100 9,717 8,911
NET CASH PROVIDED BY FINANCING ACTIVITIES 1,040,421 683,103 101,813
Increase in cash and cash equivalents 6,706 401,537 22,843
Cash and cash equivalents at beginning of year 442,658 41,121 18,278
CASH AND CASH EQUIVALENTS AT END OF YEAR $ 449,364 $ 442,658 $ 41,121
SUPPLEMENTAL DISCLOSURES OF CASH FLOW INFORMATION
Cash paid for interest $ 32,601 $ 33,741 $ 35,351
Cash paid for income taxes $ 244,337 $ 223,806 $ 242,510
Non-cash investing and financing activities:
(Decrease) increase in accrued capital expenditures $ (1,211) $ 8,859 $ 6,395
Increase in finance and capital lease obligations $ ―$ ― $ 1,739
42