CarMax 2013 Annual Report Download - page 24
Download and view the complete annual report
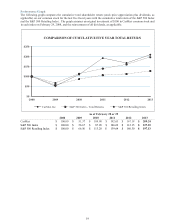
Please find page 24 of the 2013 CarMax annual report below. You can navigate through the pages in the report by either clicking on the pages listed below, or by using the keyword search tool below to find specific information within the annual report.-
 1
1 -
2
-
3
-
4
-
5
-
6
-
7
-
8
-
9
-
10
-
11
-
12
-
13
-
 14
14 -
 15
15 -
 16
16 -
 17
17 -
 18
18 -
 19
19 -
 20
20 -
 21
21 -
 22
22 -
 23
23 -
 24
24 -
 25
25 -
 26
26 -
 27
27 -
 28
28 -
 29
29 -
 30
30 -
 31
31 -
 32
32 -
 33
33 -
 34
34 -
35
-
36
-
37
-
38
-
39
-
40
-
41
-
42
-
43
-
44
-
45
-
46
-
47
-
48
-
49
-
50
-
51
-
52
-
53
-
54
-
55
-
56
-
57
-
58
-
59
-
60
-
61
-
62
-
63
-
64
-
65
-
66
-
67
-
68
-
69
-
70
-
71
-
72
-
73
-
74
-
75
-
76
-
77
-
78
-
79
-
80
-
81
-
82
-
83
-
84
-
85
-
86
-
87
-
88
 |
 |

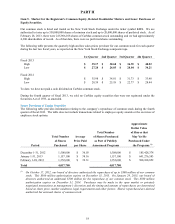
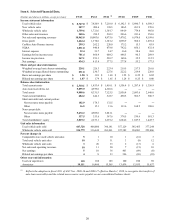
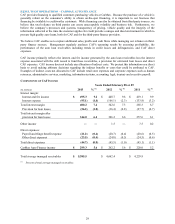
Item 6. Selected Financial Data.
(Dollars and shares in millions, except per share) FY13 FY12 FY11
(1) FY10 FY09 FY08
Income statement information
Used vehicle sales $ 8,747.0 $ 7,826.9 $ 7,210.0 $ 6,192.3 $ 5,690.7 $ 6,589.3
New vehicle sales 207.7 200.6 198.5 186.5 261.9 370.6
Wholesale vehicle sales 1,759.6 1,721.6 1,301.7 844.9 779.8 985.0
Other sales and revenues 248.6 254.5 265.3 246.6 241.6 254.6
Net sales and operating revenues 10,962.8 10,003.6 8,975.6 7,470.2 6,974.0 8,199.6
Gross profit 1,464.4 1,378.8 1,301.2 1,098.9 968.2 1,072.4
CarMax Auto Finance income 299.3 262.2 220.0 175.2 15.3 85.9
SG&A 1,031.0 940.8 878.8 792.2 856.1 832.4
Interest expense 32.4 33.7 34.7 36.0 38.6 38.0
Earnings before income taxes 701.4 666.9 608.2 446.5 90.5 289.9
Income tax provision 267.1 253.1 230.7 168.6 35.2 112.5
Net earnings 434.3 413.8 377.5 277.8 55.2 177.5
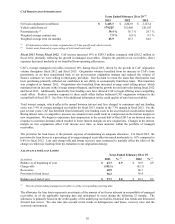
Share and per share information
Weighted average basic shares outstanding 228.1 226.3 223.4 219.5 217.5 216.0
Weighted average diluted shares outstanding 231.8 230.7 227.6 222.2 219.4 220.0
Basic net earnings per share $ 1.90 $ 1.83 $ 1.68 $ 1.25 $ 0.25 $ 0.82
Diluted net earnings per share $ 1.87 $ 1.79 $ 1.65 $ 1.24 $ 0.25 $ 0.80
Balance sheet information
Total current assets $ 2,310.1 $ 1,853.4 $ 1,410.1 $ 1,556.4 $ 1,287.8 $ 1,356.9
Auto loan receivables, net 5,895.9 4,959.8 4,320.6 ― ― ―
Total assets 9,888.6 8,331.5 7,125.5 2,856.4 2,693.6 2,646.0
Total current liabilities 684.2 646.3 522.7 490.5 502.7 500.7
Short-term debt and current portion:
Non-recourse notes payable 182.9 174.3 132.5 ― ― ―
Other 16.5 15.1 13.6 133.6 168.2 108.6
Non-current debt:
Non-recourse notes payable 5,672.2 4,509.8 3,881.1 ― ― ―
Other 337.5 353.6 367.6 378.5 539.6 581.3
Total shareholders’ equity 3,019.2 2,673.1 2,239.2 1,884.6 1,547.9 1,447.7
Unit sales information
Used vehicle units sold 447,728 408,080 396,181 357,129 345,465 377,244
Wholesale vehicle units sold 324,779 316,649 263,061 197,382 194,081 222,406
Percent changes in
Comparable store used vehicle unit sales 5 1 10 1 (16) 3
Total used vehicle unit sales 10 3 11 3 (8) 12
Wholesale vehicle unit sales 3 20 33 2 (13) 6
Net sales and operating revenues 10 11 20 7 (15) 10
Net earnings 5 10 36 403 (69) (8)
Diluted net earnings per share 4 8 33 396 (69) (10)
Other year-end information
Used car superstores 118 108 103 100 100 89
Associates 18,111 16,460 15,565 13,439 13,035 15,637
(1) Reflects the adoption in fiscal 2011 of ASU Nos. 2009-16 and 2009-17 effective March 1, 2010, to recognize the transfers of
auto loan receivables and the related non-recourse notes payable on our consolidated balance sheets.
20