CarMax 2013 Annual Report Download - page 72
Download and view the complete annual report
Please find page 72 of the 2013 CarMax annual report below. You can navigate through the pages in the report by either clicking on the pages listed below, or by using the keyword search tool below to find specific information within the annual report.-
 1
1 -
2
-
3
-
4
-
5
-
6
-
7
-
8
-
9
-
10
-
11
-
12
-
13
-
14
-
15
-
16
-
17
-
18
-
19
-
20
-
21
-
22
-
23
-
24
-
25
-
26
-
27
-
28
-
29
-
30
-
31
-
32
-
33
-
34
-
35
-
36
-
37
-
38
-
39
-
40
-
41
-
42
-
43
-
44
-
45
-
46
-
47
-
48
-
49
-
50
-
51
-
52
-
53
-
54
-
55
-
56
-
57
-
58
-
59
-
60
-
61
-
 62
62 -
 63
63 -
 64
64 -
 65
65 -
 66
66 -
 67
67 -
 68
68 -
 69
69 -
 70
70 -
 71
71 -
 72
72 -
 73
73 -
 74
74 -
 75
75 -
 76
76 -
 77
77 -
 78
78 -
 79
79 -
 80
80 -
 81
81 -
 82
82 -
83
-
84
-
85
-
86
-
87
-
88
 |
 |

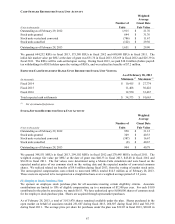
fiscal 2012 and $25.80 in fiscal 2011. The total costs for matching contributions are included in share-based
compensation expense.
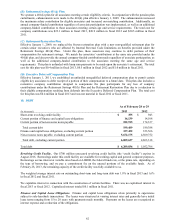
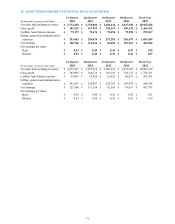
12. NET EARNINGS PER SHARE
Nonvested share-based payment awards that contain nonforfeitable rights to dividends or dividend equivalents
(whether paid or unpaid) are participating securities and should be included in the computation of net earnings per
share pursuant to the two-class method as discussed in Note 2(X). Our restricted stock awards are considered
participating securities because they contain nonforfeitable rights to dividends and are included in the computation
of net earnings per share pursuant to the two-class method. Nonvested MSUs do not receive nonforfeitable dividend
equivalent rights, and therefore, are not considered participating securities. RSUs are nonparticipating, non-equity
instruments, and therefore, are excluded from net earnings per share calculations. There were no outstanding
participating securities during fiscal 2013.
BASIC AND DILUTIVE NET EARNINGS PER SHARE RECONCILIATIONS
Years Ended February 28 or 29
(In thousands except per share data) 2013 2012 2011
N
et earnings $ 434,284 $ 413,795 $ 377,495
Less net earnings allocable to restricted stock ― 166 1,623
N
et earnings available for basic common shares 434,284 413,629 375,872
Adjustment for dilutive potential common shares ― ― 38
N
et earnings available for diluted common shares $ 434,284 $ 413,629 $ 375,910
Weighted average common shares outstanding 228,095 226,282 223,449
Dilutive potential common shares:
Stock options 3,161 3,608 3,540
Stock-settled restricted stock units 567 831 612
Weighted average common shares and dilutive
potential common shares 231,823 230,721 227,601
Basic net earnings per share $ 1.90
$ 1.83 $ 1.68
Diluted net earnings per share $ 1.87
$ 1.79 $ 1.65
Certain weighted-average options to purchase shares of common stock were outstanding and not included in the
calculation of diluted net earnings per share because their inclusion would be antidilutive. In fiscal 2013, weighted
average options to purchase 3,877,165 shares were not included. In fiscal 2012, weighted-average options to
purchase 1,750,473 shares were not included. In fiscal 2011, weighted-average options to purchase 1,656,658
shares were not included.
68