CarMax 2013 Annual Report Download - page 32
Download and view the complete annual report
Please find page 32 of the 2013 CarMax annual report below. You can navigate through the pages in the report by either clicking on the pages listed below, or by using the keyword search tool below to find specific information within the annual report.-
 1
1 -
2
-
3
-
4
-
5
-
6
-
7
-
8
-
9
-
10
-
11
-
12
-
13
-
14
-
15
-
16
-
17
-
18
-
19
-
20
-
21
-
 22
22 -
 23
23 -
 24
24 -
 25
25 -
 26
26 -
 27
27 -
 28
28 -
 29
29 -
 30
30 -
 31
31 -
 32
32 -
 33
33 -
 34
34 -
 35
35 -
 36
36 -
 37
37 -
 38
38 -
 39
39 -
 40
40 -
 41
41 -
 42
42 -
43
-
44
-
45
-
46
-
47
-
48
-
49
-
50
-
51
-
52
-
53
-
54
-
55
-
56
-
57
-
58
-
59
-
60
-
61
-
62
-
63
-
64
-
65
-
66
-
67
-
68
-
69
-
70
-
71
-
72
-
73
-
74
-
75
-
76
-
77
-
78
-
79
-
80
-
81
-
82
-
83
-
84
-
85
-
86
-
87
-
88
 |
 |

finance providers. Accordingly, changes in the relative mix of the other gross profit components can affect the
composition and amount of other gross profit.
Fiscal 2013 Versus Fiscal 2012. Other gross profit declined 1% in fiscal 2013, as improved ESP and service
department profits were more than offset by the lower net third-party finance fees.
Fiscal 2012 Versus Fiscal 2011. Other gross profit fell 10% in fiscal 2012, as the 3% growth in ESP profits was
more than offset by the lower net third-party finance fees and service department profits. Service department gross
profit declined $12.2 million primarily due to the deleverage associated with increased service overhead costs, the
modest retail unit sales growth and lower service retail sales.
Impact of Inflation
Historically, inflation has not been a significant contributor to results. Profitability is primarily affected by our
ability to achieve targeted unit sales and gross profit dollars per vehicle rather than by changes in average retail
prices. However, increases in average vehicle selling prices benefit CAF income, to the extent the average amount
financed also increases.
During fiscal 2012 and fiscal 2011, we experienced a period of appreciation in used vehicle wholesale pricing. We
believe the appreciation resulted, in part, from the reduced supply of late-model used vehicles in the market that was
caused by the dramatic decline in new car industry sales and the associated slow down in used vehicle trade-in
activity, compared with pre-recession periods. The higher wholesale values increased both our vehicle acquisition
costs and our average selling prices for used and wholesale vehicles. In fiscal 2013 and fiscal 2012, we also
experienced inflationary increases in key reconditioning costs.
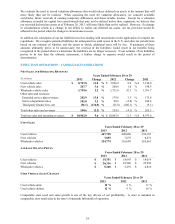
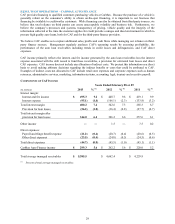
Selling, General and Administrative Expenses
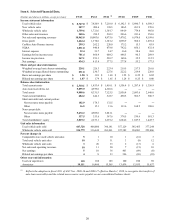
COMPONENTS OF SG&A EXPENSE
Years Ended February 28 or 29
(In millions) 2013 Change 2012 Change 2011
Compensation and benefits (1)
$581.9 11.7% $ 521.0 6.8 % $ 487.8
Store occupancy costs 199.9 6.5 % 187.6 3.3 % 181.6
Advertising expense 106.3 7.2 % 99.1 3.8 % 95.5
Other overhead costs (2)
142.9 7.5 % 133.1 16.7 % 113.9
Total SG&A expenses $ 1,031.0 9.6 % $ 940.8 7.1 % $ 878.8
(1) Excludes compensation and benefits related to reconditioning and vehicle repair service, which is included in
cost of sales.
(2) Includes IT expenses, insurance, bad debt, travel, preopening and relocation costs, charitable contributions and
other administrative expenses.
Fiscal 2013 Versus Fiscal 2012. SG&A expenses increased 10% in fiscal 2013. The increase primarily reflected
the combination of the 9% expansion in our store base during fiscal 2013 (representing the addition of 10 stores),
higher variable selling costs resulting from the 5% increase in comparable store used unit sales, and higher growth-
related costs. Growth-related costs include store pre-opening expenses, relocation expenses, and the costs of
maintaining store management bench strength to support future growth. These costs were affected by the increase in
the rate of our store openings, from 5 stores in fiscal 2012 to 10 stores in fiscal 2013. SG&A per retail unit was
consistent at $2,263 in both fiscal 2013 and fiscal 2012.
Fiscal 2012 Versus Fiscal 2011. SG&A expenses increased 7% in fiscal 2012. The increase was driven by the 5%
expansion of our store base in fiscal 2012 (representing the addition of five stores), higher growth-related costs, and
increases in variable selling costs. SG&A per retail unit rose 4% to $2,263 from $2,173 in fiscal 2011.
Income Taxes
The effective income tax rate was 38.1% in fiscal 2013, 38.0% in fiscal 2012 and 37.9% in fiscal 2011.
28