CarMax 2013 Annual Report Download - page 54
Download and view the complete annual report
Please find page 54 of the 2013 CarMax annual report below. You can navigate through the pages in the report by either clicking on the pages listed below, or by using the keyword search tool below to find specific information within the annual report.-
 1
1 -
2
-
3
-
4
-
5
-
6
-
7
-
8
-
9
-
10
-
11
-
12
-
13
-
14
-
15
-
16
-
17
-
18
-
19
-
20
-
21
-
22
-
23
-
24
-
25
-
26
-
27
-
28
-
29
-
30
-
31
-
32
-
33
-
34
-
35
-
36
-
37
-
38
-
39
-
40
-
41
-
42
-
43
-
 44
44 -
 45
45 -
 46
46 -
 47
47 -
 48
48 -
 49
49 -
 50
50 -
 51
51 -
 52
52 -
 53
53 -
 54
54 -
 55
55 -
 56
56 -
 57
57 -
 58
58 -
 59
59 -
 60
60 -
 61
61 -
 62
62 -
 63
63 -
 64
64 -
65
-
66
-
67
-
68
-
69
-
70
-
71
-
72
-
73
-
74
-
75
-
76
-
77
-
78
-
79
-
80
-
81
-
82
-
83
-
84
-
85
-
86
-
87
-
88
 |
 |

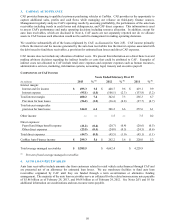
3. CARMAX AUTO FINANCE
CAF provides financing to qualified customers purchasing vehicles at CarMax. CAF provides us the opportunity to
capture additional sales, profits and cash flows while managing our reliance on third-party finance sources.
Management regularly analyzes CAF's operating results by assessing profitability, the performance of the auto loan
receivables including trends in credit losses and delinquencies, and CAF direct expenses. This information is used
to assess CAF's performance and make operating decisions including resource allocation. In addition, except for
auto loan receivables, which are disclosed in Note 4, CAF assets are not separately reported nor do we allocate
assets to CAF because such allocation would not be useful to management in making operating decisions.
We securitize substantially all of the loans originated by CAF, as discussed in Note 2(F). CAF income primarily
reflects the interest and fee income generated by the auto loan receivables less the interest expense associated with
the debt issued to fund these receivables, a provision for estimated loan losses and direct CAF expenses.
CAF income does not include any allocation of indirect costs. We present this information on a direct basis to avoid
making arbitrary decisions regarding the indirect benefits or costs that could be attributed to CAF. Examples of
indirect costs not allocated to CAF include retail store expenses and corporate expenses such as human resources,
administrative services, marketing, information systems, accounting, legal, treasury and executive payroll.
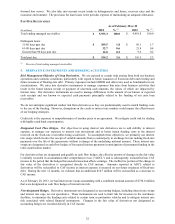
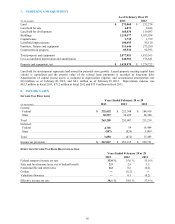
COMPONENTS OF CAF INCOME
Years Ended February 28 or 29
(In millions) 2013 % (1) 2012 % (1) 2011 % (1)
Interest margin:
Interest and fee income $495.3 9.2
$ 448.7 9.6 $ 419.1 9.9
Interest expense (95.1) (1.8) (106.1) (2.3) (133.8) (3.2)
Total interest margin 400.2 7.4 342.6 7.3 285.3 6.7
Provision for loan losses (56.2) (1.0) (36.4) (0.8) (27.7) (0.7)
Total interest margin after
provision for loan losses 344.0 6.4 306.2 6.6 257.6 6.1
Other income ― ―1.5 ― 7.5 0.2
Direct expenses:
Payroll and fringe benefit expense (21.2) (0.4) (20.7) (0.4) (20.6) (0.5)
Other direct expenses (23.5) (0.4) (24.8) (0.5) (24.5) (0.6)
Total direct expenses (44.7) (0.8) (45.5) (1.0) (45.1) (1.1)
CarMax Auto Finance income $299.3 5.6
$ 262.2 5.6 $ 220.0 5.2
Total average managed receivables $ 5,385.5 $ 4,662.4 $ 4,229.9
(1) Percent of total average managed receivables.
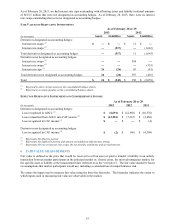
4. AUTO LOAN RECEIVABLES
Auto loan receivables include amounts due from customers related to retail vehicle sales financed through CAF and
are presented net of an allowance for estimated loan losses. We use warehouse facilities to fund auto loan
receivables originated by CAF until they are funded through a term securitization or alternative funding
arrangement. The majority of the auto loan receivables serve as collateral for the related non-recourse notes payable
of $5.86 billion as of February 28, 2013, and $4.68 billion as of February 29, 2012. See Notes 2(F) and 10 for
additional information on securitizations and non-recourse notes payable.
50