CarMax 2013 Annual Report Download - page 47
Download and view the complete annual report
Please find page 47 of the 2013 CarMax annual report below. You can navigate through the pages in the report by either clicking on the pages listed below, or by using the keyword search tool below to find specific information within the annual report.-
 1
1 -
2
-
3
-
4
-
5
-
6
-
7
-
8
-
9
-
10
-
11
-
12
-
13
-
14
-
15
-
16
-
17
-
18
-
19
-
20
-
21
-
22
-
23
-
24
-
25
-
26
-
27
-
28
-
29
-
30
-
31
-
32
-
33
-
34
-
35
-
36
-
 37
37 -
 38
38 -
 39
39 -
 40
40 -
 41
41 -
 42
42 -
 43
43 -
 44
44 -
 45
45 -
 46
46 -
 47
47 -
 48
48 -
 49
49 -
 50
50 -
 51
51 -
 52
52 -
 53
53 -
 54
54 -
 55
55 -
 56
56 -
 57
57 -
58
-
59
-
60
-
61
-
62
-
63
-
64
-
65
-
66
-
67
-
68
-
69
-
70
-
71
-
72
-
73
-
74
-
75
-
76
-
77
-
78
-
79
-
80
-
81
-
82
-
83
-
84
-
85
-
86
-
87
-
88
 |
 |

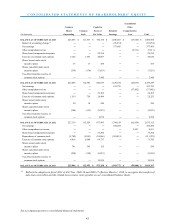
CONSOLIDATED STATEMENTS OF SHAREHOLDERS’ EQUITY
See accompanying notes to consolidated financial statements.
Accumulated
Common Capital in Other
Shares Common Excess of Retained Comprehensive
(In thousands) Outstanding Stock Par Value Earnings Loss Total
BALANCE AS OF FEBRUARY 28, 2010 223,066 $ 111,533 $ 746,134 $ 1,046,463 $ (19,546) $ 1,884,584
Impact of accounting change (1) ― ― ― (93,234) ― (93,234)
Net earnings ― ― ― 377,495 ― 377,495
Other comprehensive loss ― ― ― ― (5,511) (5,511)
Share-based compensation expense ― ― 29,214 ― ― 29,214
Exercise of common stock options 3,126 1,563 44,067 ― ― 45,630
Shares issued under stock
incentive plans 33 17 458 ― ― 475
Shares cancelled under stock
incentive plans (339) (170) (7,183) ― ― (7,353)
Tax effect from the exercise of
common stock options ― ― 7,949 ― ― 7,949
BALANCE AS OF FEBRUARY 28, 2011 225,886 112,943 820,639 1,330,724 (25,057) 2,239,249
Net earnings ― ― ― 413,795 ― 413,795
Other comprehensive loss ― ― ― ― (37,402) (37,402)
Share-based compensation expense ― ― 32,105 ― ― 32,105
Exercise of common stock options 1,519 759 24,494 ― ― 25,253
Shares issued under stock
incentive plans 20 10 540 ― ― 550
Shares cancelled under stock
incentive plans (306) (153) (9,523) ― ― (9,676)
Tax effect from the exercise of
common stock options ― ― 9,238 ― ― 9,238
BALANCE AS OF FEBRUARY 29, 2012 227,119 113,559 877,493 1,744,519 (62,459) 2,673,112
Net earnings ― ― ― 434,284 ― 434,284
Other comprehensive income ― ― ― ― 2,651 2,651
Share-based compensation expense ― ― 37,294 ― ― 37,294
Repurchases of common stock (5,762) (2,881) (24,066) (185,031) ― (211,978)
Exercise of common stock options 4,016 2,008 69,737 ― ― 71,745
Shares issued under stock
incentive plans 791 395 155 ― ― 550
Shares cancelled under stock
incentive plans (258) (128) (8,221) ― ― (8,349)
Tax effect from the exercise of
common stock options ― ― 19,858 ― ― 19,858
BALANCE AS OF FEBRUARY 28, 2013 225,906 $ 112,953 $ 972,250 $ 1,993,772 $ (59,808) $ 3,019,167
(1) Reflects the adoption in fiscal 2012 of ASU Nos. 2009-16 and 2009-17 effective March 1, 2010, to recognize the transfers of
auto loan receivables and the related non-recourse notes payable on our consolidated balance sheets.
43