CarMax 2013 Annual Report Download - page 29
Download and view the complete annual report
Please find page 29 of the 2013 CarMax annual report below. You can navigate through the pages in the report by either clicking on the pages listed below, or by using the keyword search tool below to find specific information within the annual report.-
 1
1 -
2
-
3
-
4
-
5
-
6
-
7
-
8
-
9
-
10
-
11
-
12
-
13
-
14
-
15
-
16
-
17
-
18
-
 19
19 -
 20
20 -
 21
21 -
 22
22 -
 23
23 -
 24
24 -
 25
25 -
 26
26 -
 27
27 -
 28
28 -
 29
29 -
 30
30 -
 31
31 -
 32
32 -
 33
33 -
 34
34 -
 35
35 -
 36
36 -
 37
37 -
 38
38 -
 39
39 -
40
-
41
-
42
-
43
-
44
-
45
-
46
-
47
-
48
-
49
-
50
-
51
-
52
-
53
-
54
-
55
-
56
-
57
-
58
-
59
-
60
-
61
-
62
-
63
-
64
-
65
-
66
-
67
-
68
-
69
-
70
-
71
-
72
-
73
-
74
-
75
-
76
-
77
-
78
-
79
-
80
-
81
-
82
-
83
-
84
-
85
-
86
-
87
-
88
 |
 |

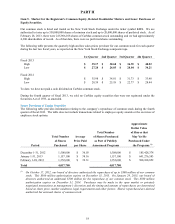
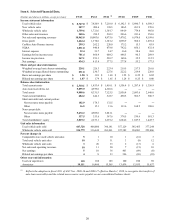
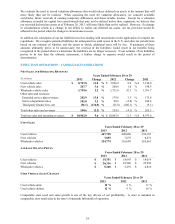
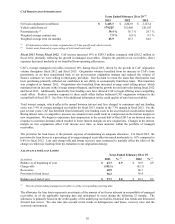
COMPARABLE STORE USED VEHICLE SALES CHANGES
Years Ended February 28 or 29
2013 2012 2011
Used vehicle units 5% 1 % 10 %
Used vehicle dollars 7% 7 % 15 %
WHOLESALE VEHICLE SALES CHANGES
Years Ended February 28 or 29
2013 2012 2011
Wholesale vehicle units 3% 20 % 33 %
Wholesale vehicle dollars 2% 32 % 54 %
CHANGE IN USED CAR SUPERSTORE BASE
Years Ended February 28 or 29
2013 2012 2011
Used car superstores, beginning of period
108 103 100
Superstore openings
10 5 3
Used car superstores, end of period 118 108 103
Used Vehicle Sales
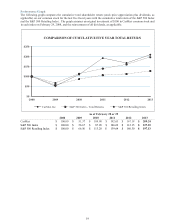
Fiscal 2013 Versus Fiscal 2012. The 12% increase in used vehicle revenues in fiscal 2013 resulted from a 10% increase
in used unit sales and a 2% increase in average retail selling price. The increase in used unit sales included a 5% increase
in comparable store used unit sales, together with sales from newer stores not yet included in the comparable store base.
The comparable store unit growth was driven by improved conversion, which we believe benefited from a variety of
factors, including more compelling credit offers from third-party finance providers and CAF, increased inventory selection
and continued strong in-store execution.
The increase in average retail selling price primarily reflected changes in our sales mix by vehicle age, with an increased
mix of ages 0-2 vehicles and a reduced mix of ages 3-4 vehicles, which corresponds to the model years in shortest supply.
The overall supply of late-model used vehicles being remarketed has remained constrained following four years of new
car industry sales at rates significantly below pre-recession levels. During much of the period from 2009 through 2011,
wholesale vehicle industry values rose, which increased our vehicle acquisition costs and average selling prices compared
with pre-recession periods. We believe the constrained supply of late-model used vehicles and the resulting increase in
selling prices has had an adverse effect on our used vehicle sales in recent years. As new car industry sales return to
historical levels, the supply of late-model used vehicles should gradually improve, which we believe will benefit our
business.
Our data indicated that we increased our share of the late-model (0- to 6-year old) used vehicle market by approximately
4% in fiscal 2013. This data also indicated that our share of the broader, 0- to 10-year old used vehicle market grew
approximately 7%, reflecting shifts in our inventory mix in recent years in response to changing consumer preferences.
We believe our ability to grow market share year after year is a reflection of the strength of our consumer offer, the
skill of our associates and the preference for our brand.
Fiscal 2012 Versus Fiscal 2011. The 9% increase in used vehicle revenues in fiscal 2012 resulted from a 5% increase in
average retail selling price and a 3% increase in unit sales. The growth in the average retail selling price primarily
reflected increases in our acquisition costs, which resulted from the year-over-year increase in used vehicle wholesale
industry values. A shift in our sales mix moderated the effect of higher acquisition costs on our average retail selling price.
During fiscal 2012, 5- to 10-year old vehicles, which generally have lower selling prices than later-model vehicles,
represented an increased portion of our sales mix.
The 3% increase in used unit sales included a 1% increase in comparable store used unit sales, together with sales from
superstores not yet included in the comparable store base. We believe the modest rate of comparable store used unit sales
growth reflected both a challenging sales comparison with fiscal 2011, when comparable store used unit sales increased
10%, and the continuation of weak economic conditions and low consumer confidence for much of fiscal 2012.
While customer traffic at comparable stores was higher than in the prior year, a larger portion of the fiscal 2012
traffic represented customers who only obtained vehicle appraisals, which contributed to a decline in sales
conversion.
25