CarMax 2013 Annual Report Download - page 30
Download and view the complete annual report
Please find page 30 of the 2013 CarMax annual report below. You can navigate through the pages in the report by either clicking on the pages listed below, or by using the keyword search tool below to find specific information within the annual report.-
 1
1 -
2
-
3
-
4
-
5
-
6
-
7
-
8
-
9
-
10
-
11
-
12
-
13
-
14
-
15
-
16
-
17
-
18
-
19
-
 20
20 -
 21
21 -
 22
22 -
 23
23 -
 24
24 -
 25
25 -
 26
26 -
 27
27 -
 28
28 -
 29
29 -
 30
30 -
 31
31 -
 32
32 -
 33
33 -
 34
34 -
 35
35 -
 36
36 -
 37
37 -
 38
38 -
 39
39 -
 40
40 -
41
-
42
-
43
-
44
-
45
-
46
-
47
-
48
-
49
-
50
-
51
-
52
-
53
-
54
-
55
-
56
-
57
-
58
-
59
-
60
-
61
-
62
-
63
-
64
-
65
-
66
-
67
-
68
-
69
-
70
-
71
-
72
-
73
-
74
-
75
-
76
-
77
-
78
-
79
-
80
-
81
-
82
-
83
-
84
-
85
-
86
-
87
-
88
 |
 |

Our data indicated that we increased our share of the late model used vehicle market by approximately 3% in
fiscal 2012. We achieved market share growth despite a shift within the market for 0- to 6-year old vehicles towards
older used vehicles and having fewer immature stores (those less than five years old) in our store base due to our
temporary suspension of store growth. Historically, market share gains are strongest among immature stores.
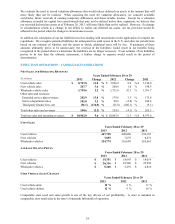
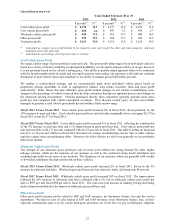
Wholesale Vehicle Sales
We seek to build customer satisfaction by offering high-quality vehicles. Fewer than half of the vehicles acquired
from consumers through the appraisal purchase process meet our standards for reconditioning and subsequent retail
sale. Those vehicles that do not meet our standards are sold through on-site wholesale auctions. Our wholesale
auction prices usually reflect the trends in the general wholesale market for the types of vehicles we sell, although
they can also be affected by changes in vehicle mix or the average age, mileage or condition of the vehicles sold.
Fiscal 2013 Versus Fiscal 2012. The 2% increase in wholesale vehicle revenues in fiscal 2013 resulted from a 3%
increase in wholesale unit sales offset by a slight reduction in average wholesale vehicle selling price. The
wholesale unit growth included the combined effects of the growth in our store base and higher appraisal traffic,
offset by a lower appraisal buy rate. The modest growth in wholesale unit sales also reflected the challenging
comparisons with fiscal 2012 and fiscal 2011, when wholesale unit sales grew 20% and 33%, respectively.
Fiscal 2012 Versus Fiscal 2011. The 32% increase in wholesale vehicle revenues in fiscal 2012 resulted from a
20% increase in wholesale unit sales combined with a 10% increase in average wholesale vehicle selling price. The
increase in unit sales primarily reflected a significant increase in appraisal traffic. While the appraisal buy rate
remained high relative to historical averages, it declined modestly from the prior year. Our appraisal traffic
benefited from the increase in customer traffic in our stores and from the lift in new car industry sales and related
used vehicle trade-in activity in fiscal 2012.
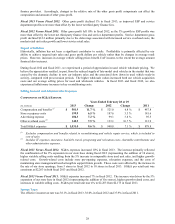
Other Sales and Revenues
Other sales and revenues include commissions on the sale of ESPs and GAP (reported in ESP revenues), service
department sales and net third-party finance fees. The fixed, per-vehicle fees paid to us by prime and nonprime
third-party finance providers may vary, reflecting the providers’ differing levels of credit risk exposure. The fixed,
per-vehicle fees that we pay to the subprime providers are reflected as an offset to finance fee revenues received
from prime and nonprime providers.
Fiscal 2013 Versus Fiscal 2012. Other sales and revenues declined 2% in fiscal 2013, as an increase in ESP
revenues was more than offset by a decrease in net third-party finance fees. ESP revenues increased 13%, primarily
reflecting the growth in our retail vehicle unit sales and an increase in ESP penetration. The decrease in net third-
party finance fees was driven by a mix shift among providers, including an increase in the percentage of our retail
unit sales financed by the subprime providers to 15% in fiscal 2013 versus 10% in fiscal 2012. The growth in the
subprime sales mix primarily resulted from more compelling credit offers being made by the subprime providers.
Fiscal 2012 Versus Fiscal 2011. Other sales and revenues declined 4% in fiscal 2012, as a 3% increase in ESP
revenues was more than offset by a decrease in net third-party finance fees resulting from a mix change among
providers. Subprime providers financed 10% of our retail vehicle unit sales in fiscal 2012 compared with 8% in
fiscal 2011. The reduction in net third-party finance fees also reflected the decision by CAF to retain an increased
portion of the loans that third-party providers had been purchasing following CAF’s tightening of lending standards
beginning in fiscal 2010. As CAF retained an increased portion of these loans, the fees previously received from
third parties declined.
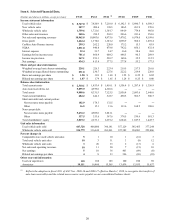
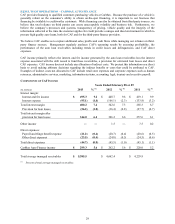
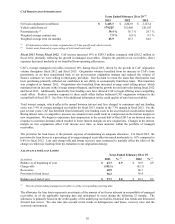
GROSS PROFIT
Years Ended February 28 or 29
(In millions) 2013 Change 2012 Change 2011
Used vehicle gross profit $971.5 9.3%
$ 888.6 4.0 % $ 854.0
N
ew vehicle gross profit 5.0 (23.8)% 6.5 19.9 % 5.4
Wholesale vehicle gross profit 308.1 2.1 % 301.8 26.4 % 238.8
Other gross profit 179.8 (1.2)% 181.9 (10.4) % 203.0
Total $ 1,464.4 6.2 % $ 1,378.8 6.0 % $ 1,301.2
26