CarMax 2013 Annual Report Download - page 35
Download and view the complete annual report
Please find page 35 of the 2013 CarMax annual report below. You can navigate through the pages in the report by either clicking on the pages listed below, or by using the keyword search tool below to find specific information within the annual report.-
 1
1 -
2
-
3
-
4
-
5
-
6
-
7
-
8
-
9
-
10
-
11
-
12
-
13
-
14
-
15
-
16
-
17
-
18
-
19
-
20
-
21
-
22
-
23
-
24
-
 25
25 -
 26
26 -
 27
27 -
 28
28 -
 29
29 -
 30
30 -
 31
31 -
 32
32 -
 33
33 -
 34
34 -
 35
35 -
 36
36 -
 37
37 -
 38
38 -
 39
39 -
 40
40 -
 41
41 -
 42
42 -
 43
43 -
 44
44 -
 45
45 -
46
-
47
-
48
-
49
-
50
-
51
-
52
-
53
-
54
-
55
-
56
-
57
-
58
-
59
-
60
-
61
-
62
-
63
-
64
-
65
-
66
-
67
-
68
-
69
-
70
-
71
-
72
-
73
-
74
-
75
-
76
-
77
-
78
-
79
-
80
-
81
-
82
-
83
-
84
-
85
-
86
-
87
-
88
 |
 |

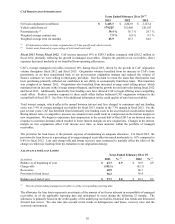
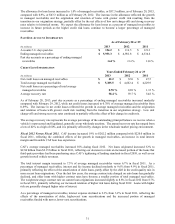
The allowance for loan losses increased to 1.0% of managed receivables, or $57.3 million, as of February 28, 2013,
compared with 0.9%, or $43.3 million as of February 29, 2012. The increase in the allowance reflected the growth
in managed receivables and the origination and retention of loans with greater credit risk resulting from the
transition in our origination strategy, partially offset by the net effects of low unit charge-offs and strong recovery
rates relative to historical norms. We expect the allowance for loan losses as a percent of managed receivables to
increase in future periods as the higher credit risk loans continue to become a larger percentage of managed
receivables.
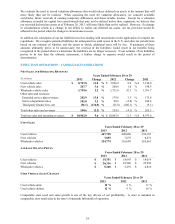
PAST DUE ACCOUNT INFORMATION
As of February 28 or 29
(In millions) 2013 2012 2011
Accounts 31+ days past due $ 154.2 $ 116.5 $ 121.3
Ending managed receivables $ 5,933.3 $ 4,981.8 $ 4,334.6
Past due accounts as a percentage of ending managed
receivables 2.60 % 2.34 % 2.80 %
CREDIT LOSS INFORMATION
Years Ended February 28 or 29
(In millions) 2013 2012 2011
N
et credit losses on managed receivables $ 42.2 $ 32.0 $ 47.5
Total average managed receivables $ 5,385.5 $ 4,662.4 $ 4,229.9
N
et credit losses as a percentage of total average
managed receivables 0.78 % 0.69 % 1.12 %
Average recovery rate 58.4 % 59.7 %
54.8 %
As of February 28, 2013, past due accounts as a percentage of ending managed receivables increased modestly
compared with February 29, 2012, while net credit losses increased to 0.78% of average managed receivables from
0.69%. The increase in net credit losses reflected the growth in average managed receivables and the origination
and retention of loans with greater credit risk resulting from the transition in our origination strategy. Low unit
charge-offs and strong recovery rates continued to partially offset the effect of this change in credit mix.
The average recovery rate represents the average percentage of the outstanding principal balance we receive when a
vehicle is repossessed and liquidated, generally at our wholesale auctions. The annual recovery rate has ranged from
a low of 42% to a high of 60%, and it is primarily affected by changes in the wholesale market pricing environment.
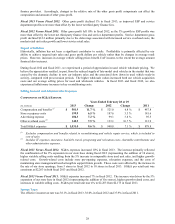
Fiscal 2012 Versus Fiscal 2011. CAF income increased 19% to $262.2 million compared with $220.0 million in
fiscal 2011, reflecting the combined effects of the growth in managed receivables, an increase in total interest
margin and favorable CAF loan loss experience.
CAF’s average managed receivables increased 10% during fiscal 2012. Net loans originated increased 32% to
$2.84 billion from $2.15 billion in fiscal 2011, reflecting our decision to retain an increased portion of the loans that
third-party providers had been purchasing since CAF’s tightening of lending standards in fiscal 2010, as well as our
growth in retail vehicle revenues.
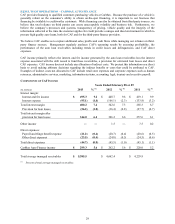
The total interest margin increased to 7.3% of average managed receivables versus 6.7% in fiscal 2011. As a
percentage of managed receivables, interest and fee income declined modestly to 9.6% from 9.9% in fiscal 2011,
primarily reflecting the effect of the amortization of older loans, partly offset by the shift in the credit quality mix in
more recent loan originations. Over the last few years, the average contract rate charged on auto loans has gradually
declined, and older loans with higher contract rates have become a smaller portion of total managed receivables.
The weighted average contract rate on current loan originations increased slightly to 8.8% in fiscal 2012 from 8.7%
in fiscal 2011, primarily reflecting our increased retention of higher risk loans during fiscal 2012. Loans with higher
risk are generally charged higher rates of interest.
As a percentage of managed receivables, interest expense declined to 2.3% from 3.2% in fiscal 2011, reflecting the
effects of the amortization of older, higher-cost term securitizations and the increased portion of managed
receivables funded with newer, lower-cost securitizations.
31