CarMax 2013 Annual Report Download - page 70
Download and view the complete annual report
Please find page 70 of the 2013 CarMax annual report below. You can navigate through the pages in the report by either clicking on the pages listed below, or by using the keyword search tool below to find specific information within the annual report.-
 1
1 -
2
-
3
-
4
-
5
-
6
-
7
-
8
-
9
-
10
-
11
-
12
-
13
-
14
-
15
-
16
-
17
-
18
-
19
-
20
-
21
-
22
-
23
-
24
-
25
-
26
-
27
-
28
-
29
-
30
-
31
-
32
-
33
-
34
-
35
-
36
-
37
-
38
-
39
-
40
-
41
-
42
-
43
-
44
-
45
-
46
-
47
-
48
-
49
-
50
-
51
-
52
-
53
-
54
-
55
-
56
-
57
-
58
-
59
-
 60
60 -
 61
61 -
 62
62 -
 63
63 -
 64
64 -
 65
65 -
 66
66 -
 67
67 -
 68
68 -
 69
69 -
 70
70 -
 71
71 -
 72
72 -
 73
73 -
 74
74 -
 75
75 -
 76
76 -
 77
77 -
 78
78 -
 79
79 -
 80
80 -
81
-
82
-
83
-
84
-
85
-
86
-
87
-
88
 |
 |

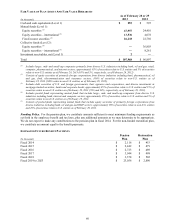
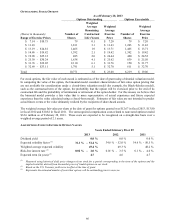
OUTSTANDING STOCK OPTIONS
As of February 28, 2013
Options Outstanding Options Exercisable
Weighted
Average Weighted Weighted
Remaining Average Average
(Shares in thousands) Number of Contractual Exercise Number of Exercise
Range of Exercise Prices Shares Life (Years) Price Shares Price
$ 7.14 - $10.75 79 0.1 $ 7.20 79 $ 7.20
$ 11.43 1,811 3.1 $ 11.43 1,263 $ 11.43
$ 13.19 - $14.81 1,465 1.9 $ 13.71 1,465 $ 13.71
$ 14.86 - $19.82 1,392 2.1 $ 19.42 1,392 $ 19.42
$ 19.98 - $25.12 485 2.0 $ 24.44 420 $ 24.52
$ 25.39 - $30.24 1,638 4.1 $ 25.62 839 $ 25.50
$ 31.76 - $32.05 2,110 6.1 $ 31.76 150 $ 31.77
$ 32.69 - $33.11 1,791 5.1 $ 32.70 611 $ 32.70
Total 10,771 3.8 $ 23.00 6,219 $ 19.06
For stock options, the fair value of each award is estimated as of the date of grant using a binomial valuation model.
In computing the value of the option, the binomial model considers characteristics of fair-value option pricing that
are not available for consideration under a closed-form valuation model (for example, the Black-Scholes model),
such as the contractual term of the option, the probability that the option will be exercised prior to the end of its
contractual life and the probability of termination or retirement of the option holder. For this reason, we believe that
the binomial model provides a fair value that is more representative of actual experience and future expected
experience than the value calculated using a closed-form model. Estimates of fair value are not intended to predict
actual future events or the value ultimately realized by the recipients of share-based awards.
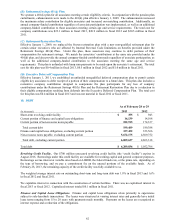
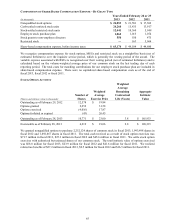
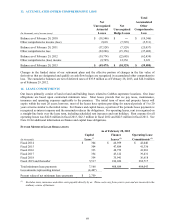
The weighted average fair value per share at the date of grant for options granted was $12.67 in fiscal 2013, $13.80
in fiscal 2012 and $10.82 in fiscal 2011. The unrecognized compensation costs related to nonvested options totaled
$32.6 million as of February 28, 2013. These costs are expected to be recognized on a straight-line basis over a
weighted average period of 2.1 years.
ASSUMPTIONS USED TO ESTIMATE OPTION VALUES
Years Ended February 28 or 29
2013 2012 2011
Dividend yield 0.0 %
0.0 % 0.0 %
Expected volatility factor (1) 31.1 % - 51.4 % 34.8 % - 52.0 % 34.6 % - 50.5 %
Weighted average expected volatility 49.4 %
49.3 % 48.2 %
Risk-free interest rate (2) 0.02 % - 2.0 % 0.01 % - 3.5 % 0.1 % - 4.0 %
Expected term (in years) (3) 4.7
4.6 4.7
(1) Measured using historical daily price changes of our stock for a period corresponding to the term of the options and the
implied volatility derived from the market prices of traded options on our stock.
(2) Based on the U.S. Treasury yield curve in effect at the time of grant.
(3) Represents the estimated number of years that options will be outstanding prior to exercise.
66