CarMax 2013 Annual Report Download - page 69
Download and view the complete annual report
Please find page 69 of the 2013 CarMax annual report below. You can navigate through the pages in the report by either clicking on the pages listed below, or by using the keyword search tool below to find specific information within the annual report.-
 1
1 -
2
-
3
-
4
-
5
-
6
-
7
-
8
-
9
-
10
-
11
-
12
-
13
-
14
-
15
-
16
-
17
-
18
-
19
-
20
-
21
-
22
-
23
-
24
-
25
-
26
-
27
-
28
-
29
-
30
-
31
-
32
-
33
-
34
-
35
-
36
-
37
-
38
-
39
-
40
-
41
-
42
-
43
-
44
-
45
-
46
-
47
-
48
-
49
-
50
-
51
-
52
-
53
-
54
-
55
-
56
-
57
-
58
-
 59
59 -
 60
60 -
 61
61 -
 62
62 -
 63
63 -
 64
64 -
 65
65 -
 66
66 -
 67
67 -
 68
68 -
 69
69 -
 70
70 -
 71
71 -
 72
72 -
 73
73 -
 74
74 -
 75
75 -
 76
76 -
 77
77 -
 78
78 -
 79
79 -
80
-
81
-
82
-
83
-
84
-
85
-
86
-
87
-
88
 |
 |

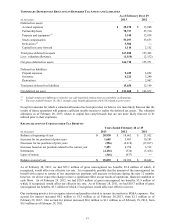
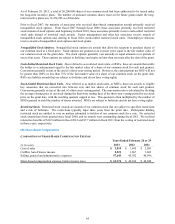
COMPOSITION OF SHARE-BASED COMPENSATION EXPENSE – BY GRANT TYPE
Years Ended February 28 or 29
(In thousands) 2013 2012 2011
N
onqualified stock options $ 24,853 $ 21,581 $ 17,302
Cash-settled restricted stock units 24,268 15,435 13,917
Stock-settled restricted stock units 12,441 10,360 5,948
Employee stock purchase plan 1,062 1,015 1,074
Stock grants to non-employee directors 550 550 475
Restricted stock ― 163 5,964
Share-based compensation expense, before income taxes $ 63,174 $ 49,104 $ 44,680
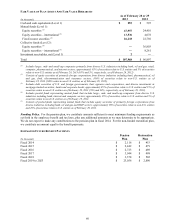
We recognize compensation expense for stock options, MSUs and restricted stock on a straight-line basis (net of
estimated forfeitures) over the requisite service period, which is generally the vesting period of the award. The
variable expense associated with RSUs is recognized over their vesting period (net of estimated forfeitures) and is
calculated based on the volume-weighted average price of our common stock on the last trading day of each
reporting period. The total costs for matching contributions for our employee stock purchase plan are included in
share-based compensation expense. There were no capitalized share-based compensation costs as of the end of
fiscal 2013, fiscal 2012 or fiscal 2011.
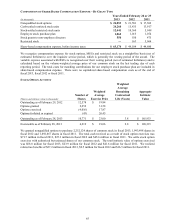
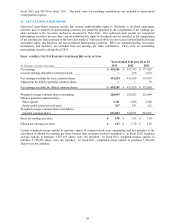
STOCK OPTION ACTIVITY
Weighted
Average
Weighted Remaining Aggregate
Number of Average Contractual Intrinsic
(Shares and intrinsic value in thousands) Shares Exercise Price Life (Years) Value
Outstanding as of February 29, 2012 12,578 $ 19.84
Options granted 2,252 31.58
Options exercised (4,016) 17.87
Options forfeited or expired (43) 26.45
Outstanding as of February 28, 2013 10,771 $ 23.00 3.8 $ 165,933
Exercisable as of February 28, 2013 6,219 $ 19.06 2.8 $ 120,315
We granted nonqualified options to purchase 2,252,124 shares of common stock in fiscal 2013, 1,993,498 shares in
fiscal 2012 and 1,892,867 shares in fiscal 2011. The total cash received as a result of stock option exercises was
$71.7 million in fiscal 2013, $25.3 million in fiscal 2012 and $45.6 million in fiscal 2011. We settle stock option
exercises with authorized but unissued shares of our common stock. The total intrinsic value of options exercised
was $68.0 million for fiscal 2013, $23.9 million for fiscal 2012 and $41.6 million for fiscal 2011. We realized
related tax benefits of $27.2 million in fiscal 2013, $9.5 million for fiscal 2012 and $16.5 million for fiscal 2011.
65