CarMax 2013 Annual Report Download - page 31
Download and view the complete annual report
Please find page 31 of the 2013 CarMax annual report below. You can navigate through the pages in the report by either clicking on the pages listed below, or by using the keyword search tool below to find specific information within the annual report.-
 1
1 -
2
-
3
-
4
-
5
-
6
-
7
-
8
-
9
-
10
-
11
-
12
-
13
-
14
-
15
-
16
-
17
-
18
-
19
-
20
-
 21
21 -
 22
22 -
 23
23 -
 24
24 -
 25
25 -
 26
26 -
 27
27 -
 28
28 -
 29
29 -
 30
30 -
 31
31 -
 32
32 -
 33
33 -
 34
34 -
 35
35 -
 36
36 -
 37
37 -
 38
38 -
 39
39 -
 40
40 -
 41
41 -
42
-
43
-
44
-
45
-
46
-
47
-
48
-
49
-
50
-
51
-
52
-
53
-
54
-
55
-
56
-
57
-
58
-
59
-
60
-
61
-
62
-
63
-
64
-
65
-
66
-
67
-
68
-
69
-
70
-
71
-
72
-
73
-
74
-
75
-
76
-
77
-
78
-
79
-
80
-
81
-
82
-
83
-
84
-
85
-
86
-
87
-
88
 |
 |

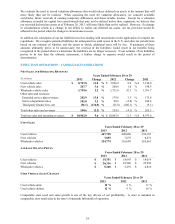
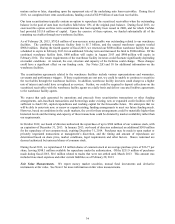
GROSS PROFIT PER UNIT
Years Ended February 28 or 29
2013 2012 2011
$ per unit (1) %
(2) $ per unit
(1) %
(2) $ per unit
(1) %
(2)
Used vehicle gross profit $2,170 11.1
$ 2,177 11.4 $ 2,156 11.8
N
ew vehicle gross profit $630 2.4
$ 847 3.2 $ 659 2.7
Wholesale vehicle gross profit $949 17.5
$ 953 17.5 $ 908 18.3
Other gross profit $395 72.3
$ 438 71.5 $ 502 76.5
Total gross profit $3,214 13.4
$ 3,316 13.8 $ 3,218 14.5
(1) Calculated as category gross profit divided by its respective units sold, except the other and total categories, which are
divided by total retail units sold.
(2) Calculated as a percentage of its respective sales or revenue.
Used Vehicle Gross Profit
We target a dollar range of gross profit per used unit sold. The gross profit dollar target for an individual vehicle is
based on a variety of factors, including its anticipated probability of sale and its mileage relative to its age; however,
it is not primarily based on the vehicle’s selling price. Our ability to quickly adjust appraisal offers to be consistent
with the broader market trade-in trends and our rapid inventory turns reduce our exposure to the inherent continual
fluctuation in used vehicle values and contribute to our ability to manage gross profit dollars per unit.
We employ a volume-based strategy, and we systematically mark down individual vehicle prices based on
proprietary pricing algorithms in order to appropriately balance sales trends, inventory turns and gross profit
achievement. Other factors that may influence gross profit include changes in our vehicle reconditioning costs,
changes in the percentage of vehicles sourced directly from consumers through our appraisal process and changes in
the wholesale pricing environment. Vehicles purchased directly from consumers typically generate more gross
profit per unit compared with vehicles purchased at auction. Over the past several years, we have successfully
managed to generate a used vehicle gross profit per unit within a fairly narrow range.
Fiscal 2013 Versus Fiscal 2012. Used vehicle gross profit increased 9% in fiscal 2013, driven primarily by the
10% increase in used unit sales. Used vehicles gross profit per unit was only marginally lower, averaging $2,170 in
fiscal 2013 versus $2,177 in fiscal 2012.
Fiscal 2012 Versus Fiscal 2011. Used vehicle gross profit increased 4% in fiscal 2011, reflecting the combination
of the 3% increase in used unit sales and a 1% improvement in gross profit per unit. Used vehicle gross profit per
unit increased $21 to $2,177 per unit compared with $2,156 per unit in fiscal 2011. Our shift to selling an increased
mix of 5- to 10-year old vehicles in fiscal 2012 increased our average reconditioning cost per unit, as older vehicles
typically require more reconditioning effort. However, the older vehicles we sold were generally no less profitable
than newer models.
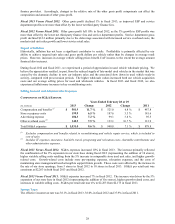
Wholesale Vehicle Gross Profit
The strength of our wholesale gross profit per unit in recent years reflects the strong demand for older, higher
mileage vehicles, which are the mainstay of our auctions, as well as the continued strong dealer attendance and
resulting high dealer-to-car ratios at our auctions. The frequency of our auctions, which are generally held weekly
or bi-weekly, minimizes the depreciation risk on these vehicles.
Fiscal 2013 Versus Fiscal 2012. Wholesale vehicle gross profit increased 2% in fiscal 2013, driven by the 3%
increase in wholesale unit sales. Wholesale gross profit per unit was relatively stable, declining only $4 per unit.
Fiscal 2012 Versus Fiscal 2011. Wholesale vehicle gross profit increased 26% in fiscal 2012. The improvement
reflected the 20% increase in wholesale unit sales combined with a 5% rise in wholesale vehicle gross profit per
unit, to $953 per unit from $908 per unit in fiscal 2011. The year-over-year increase in industry pricing and strong
dealer demand contributed to the improved wholesale gross profit per unit.
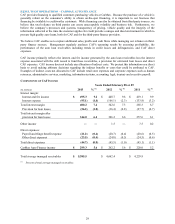
Other Gross Profit
Other gross profit includes profits related to ESP and GAP revenues, net third-party finance fees and the service
department. We have no cost of sales related to ESP and GAP revenues or net third-party finance fees, as these
represent commissions paid to us by certain third-party providers, net of the fees we pay to third-party subprime
27