CarMax 2000 Annual Report Download - page 80
Download and view the complete annual report
Please find page 80 of the 2000 CarMax annual report below. You can navigate through the pages in the report by either clicking on the pages listed below, or by using the keyword search tool below to find specific information within the annual report.-
 1
1 -
2
-
3
-
4
-
5
-
6
-
7
-
8
-
9
-
10
-
11
-
12
-
13
-
14
-
15
-
16
-
17
-
18
-
19
-
20
-
21
-
22
-
23
-
24
-
25
-
26
-
27
-
28
-
29
-
30
-
31
-
32
-
33
-
34
-
35
-
36
-
37
-
38
-
39
-
40
-
41
-
42
-
43
-
44
-
45
-
46
-
47
-
48
-
49
-
50
-
51
-
52
-
53
-
54
-
55
-
56
-
57
-
58
-
59
-
60
-
61
-
62
-
63
-
64
-
65
-
66
-
67
-
68
-
69
-
 70
70 -
 71
71 -
 72
72 -
 73
73 -
 74
74 -
 75
75 -
 76
76 -
 77
77 -
 78
78 -
 79
79 -
 80
80 -
 81
81 -
 82
82 -
 83
83 -
 84
84 -
 85
85 -
 86
86
 |
 |

CIRCUIT CITY STORES, INC. 2000 ANNUAL REPORT
78
For the purpose of computing the pro forma amounts indicated,the fair
value of each option on the date of grant is estimated using the Black-
Scholes option-pricing model. The weighted average assumptions used
in the model are as follows:
2000 1999 1998
Expected dividend yield....................................... – – –
Expected stock volatility ...................................... 62% 50% 50%
Risk-free interest rates......................................... 6% 6% 6%
Expected lives (in years)...................................... 4 3 3
Using these assumptions in the Black-Scholes model,the weighted aver-
age fair value of options granted for the CarMax Group is $3 in fiscal
2000,$3 in fiscal 1999 and $6 in fiscal 1998.
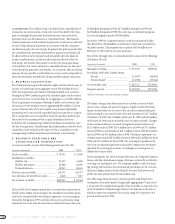
10. NET EARNINGS (LOSS) PER SHARE
The calculation of net earnings (loss) per share is presented below:
(Amounts in thousands Years Ended February 29 or 28
except per share data) 2000 1999 1998
Weighted average common shares............. 23,778 22,604 22,001
Dilutive potential common shares:
Options ................................................ 1,814 – –
Restricted stock ................................... 196 – –
Weighted average common shares
and dilutive potential
common shares.................................... 25,788 22,604 22,001
Net earnings (loss) available to common
shareholders......................................... $ 256 $(5,457) $(7,763)
Basic net earnings (loss) per share............ $0.01 $ (0.24) $ (0.35)
Diluted net earnings (loss) per share ........ $0.01 $ (0.24) $ (0.35)
Certain options were not included in the computation of diluted net earnings
per share because the options’exercise prices were greater than the average
market price of the common shares.Options to purchase 1,685,400 shares of
CarMax Group Stock ranging from $3.90 to $16.31 per share were outstand-
ing and not included in the calculation at the end of fiscal 2000. Prior to
fiscal 2000,dilutive potential common shares of CarMax Group Stock were
not included in the calculation of diluted net loss per share because the
Group had a net loss for those periods.
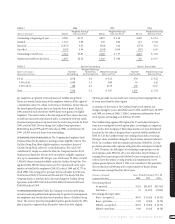
11. PENSION PLAN
The Company has a noncontributory defined benefit pension plan cover-
ing the majority of full-time employees who are at least age 21 and have
completed one year of service. The cost of the program is being funded
currently. Plan benefits generally are based on years of service and aver-
age compensation. Plan assets consist primarily of equity securities and
included 160,000 shares of Circuit City Group Stock at February 29, 2000
and February 28, 1999.
Eligible employees of the CarMax Group participate in the Company’s plan.
Pension costs for these employees have been allocated to the CarMax Group
based on its proportionate share of the projected benefit obligation. The fol-
lowing tables set forth the CarMax Group’s share of the Plan’s financial sta-
tus and amounts recognized in the balance sheets as of February 29 or 28:
(Amounts in thousands) 2000 1999
Change in benefit obligation:
Benefit obligation at beginning of year...................... $ 2,565 $ 958
Service cost ................................................................ 1,250 525
Interest cost................................................................ 173 67
Actuarial loss ............................................................. 455 1,015
Benefit obligation at end of year................................ $ 4,443 $ 2,565
Change in plan assets:
Fair value of plan assets at beginning of year............ $ 1,553 $ 1,242
Actual return on plan assets ...................................... 259 69
Employer contributions............................................. 625 242
Fair value of plan assets at end of year ...................... $ 2,437 $ 1,553
Reconciliation of funded status:
Funded status............................................................. $(2,006) $(1,012)
Unrecognized actuarial loss ...................................... 1,340 1,063
Unrecognized transition asset ................................... (6) (8)
Unrecognized prior service benefit............................ (6) (8)
Net amount recognized.............................................. $ (678) $ 35
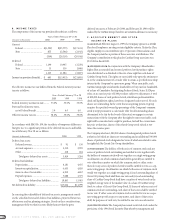
The components of net pension expense are as follows:
Years Ended February 29 or 28
(Amounts in thousands) 2000 1999 1998
Service cost............................................ $1,250 $ 525 $219
Interest cost........................................... 173 67 39
Expected return on plan assets ............. (159) (119) (73)
Amortization of prior service cost ........ (3) (1) (1)
Amortization of transitional asset ........ (2) (3) (3)
Recognized actuarial loss...................... 77 – 17
Net pension expense.............................. $1,336 $ 469 $198
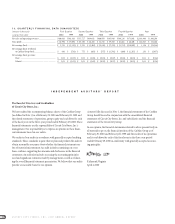
Assumptions used in the accounting for the pension plan were:
Years Ended February 29 or 28
2000 1999 1998
Weighted average discount rate ................. 8.0% 6.8% 7.0%
Rate of increase in compensation levels .... 6.0% 5.0% 5.0%
Expected rate of return on plan assets ...... 9.0% 9.0% 9.0%