CarMax 2000 Annual Report Download - page 27
Download and view the complete annual report
Please find page 27 of the 2000 CarMax annual report below. You can navigate through the pages in the report by either clicking on the pages listed below, or by using the keyword search tool below to find specific information within the annual report.-
 1
1 -
2
-
3
-
4
-
5
-
6
-
7
-
8
-
9
-
10
-
11
-
12
-
13
-
14
-
15
-
16
-
 17
17 -
 18
18 -
 19
19 -
 20
20 -
 21
21 -
 22
22 -
 23
23 -
 24
24 -
 25
25 -
 26
26 -
 27
27 -
 28
28 -
 29
29 -
 30
30 -
 31
31 -
 32
32 -
 33
33 -
 34
34 -
 35
35 -
 36
36 -
 37
37 -
38
-
39
-
40
-
41
-
42
-
43
-
44
-
45
-
46
-
47
-
48
-
49
-
50
-
51
-
52
-
53
-
54
-
55
-
56
-
57
-
58
-
59
-
60
-
61
-
62
-
63
-
64
-
65
-
66
-
67
-
68
-
69
-
70
-
71
-
72
-
73
-
74
-
75
-
76
-
77
-
78
-
79
-
80
-
81
-
82
-
83
-
84
-
85
-
86
 |
 |

CIRCUIT CITY STORES, INC. 2000 ANNUAL REPORT 25
CIRCUIT CITY STORES, INC.
1.6 percent of total sales in fiscal 2000,1.9 percent in fiscal 1999 and
1.4 percent in fiscal 1998.
IMPACT OF INFLATION. Inflation has not been a significant contributor to
the Company’s results. For the Circuit City Group,average retail prices
have declined in virtually all product categories during the past three
years. Although product introductions could help reverse this trend in
selected areas, management expects no significant short-term change
overall. Because the Group purchases substantially all products in U.S.
dollars,prices are not directly impacted by the value of the dollar in rela-
tion to other foreign currencies,including the Japanese yen.
For the CarMax Group,inflation has not been a significant contributor
to the Group’s results. The Group’s profitability is based on achieving
specific gross profit dollars per unit rather than on average retail prices.
Because the wholesale market generally adjusts to reflect retail price
trends,management believes that if the stores meet inventory turn objec-
tives,then changes in average retail prices will have only a short-term
impact on the Group’s gross margin and thus profitability.
Cost of Sales, Buying and Warehousing
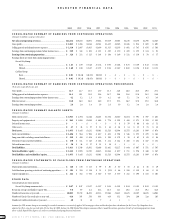
The gross profit margin was 22.7 percent of sales in fiscal 2000 and fiscal
1999 compared with 23.0 percent in fiscal 1998. The fiscal 2000 gross
profit margin includes higher gross profit margins for both the Circuit
City and CarMax businesses. The Circuit City improvement reflects a
higher percentage of sales from better-featured products and newer tech-
nologies,which carry higher gross margins,partly offset by the strength
in personal computer sales,which carry lower gross margins. Continued
improvements in inventory management also contributed to the Circuit
City Group’s gross margin increase. At the end of fiscal 1998, CarMax
instituted a profit improvement plan that included better inventory man-
agement,increased retail service sales,pricing adjustments and the addi-
tion of consumer electronic accessory sales. The success of this plan was
the significant contributor to improved gross profit margins for that busi-
ness in both fiscal 2000 and fiscal 1999. The significant increase in new-
car sales as a percentage of total sales partly offset the improvements
since new vehicles carry lower gross profit margins than used vehicles.
Because the CarMax business produces lower gross margins than the Circuit
City business,the increased sales contribution from CarMax reduces the
Company’s overall gross profit margin even though the CarMax Group’s
gross profit margin increased from fiscal 1999 to fiscal 2000. The Com-
pany’s fiscal 1999 gross profit margin reflects,for the Circuit City Group,
the strength of the personal computer business and the competitive price
environment partly offset by better inventory management and increased
sales of better-featured products and,for the CarMax Group,the impact
of the profit improvement plan partly offset by the increase in new-car
sales as a percentage of total sales.
Selling, General and Administrative Expenses
Selling, general and administrative expenses were 18.3 percent of sales in
fiscal 2000, compared with 19.3 percent of sales in fiscal 1999 and 20.5
percent of sales in fiscal 1998. The fiscal 2000 expense ratio primarily
reflects expense leverage from the comparable store sales increase for the
Circuit City Group and expense leverage from the total and comparable
store sales increases and productivity improvements resulting from the
slower expansion rate,implementation of the hub and satellite operating
strategy and operating expense controls for the CarMax Group. The
improvement at CarMax was partly offset by $4.8 million in lease termi-
nation costs on undeveloped property and a write-down of assets associ-
ated with excess property for sale. The lower expense ratio in fiscal 1999
compared with fiscal 1998 primarily reflects the expense leverage gener-
ated by the Circuit City Group’s comparable store sales increase.CarMax’s
expense ratio exceeded expectations in both years,reflecting the costs
associated with expansion and below-plan sales in both years.Because
CarMax operates with a lower expense structure,it reduces the Company’s
overall expense-to-sales ratio. Operating profits generated by the Company’s
finance operations are recorded as a reduction to selling,general and
administrative expenses.
Interest Expense
Interest expense was 0.2 percent of sales in fiscal 2000, fiscal 1999 and
fiscal 1998. Interest expense was incurred on debt used to fund store
expansion and working capital,including inventory.
Earnings from Continuing Operations
Earnings from continuing operations for Circuit City Stores, Inc.
increased 55 percent to $327.8 million in fiscal 2000. The increase reflects
a 39 percent earnings increase achieved by the Circuit City business and a
profit achieved by the CarMax Group. In fiscal 1999,earnings from con-
tinuing operations were $211.5 million compared with earnings from
continuing operations of $124.9 million in fiscal 1998.
Loss from Discontinued Operations
On June 16, 1999, Digital Video Express announced that it would cease
marketing of the Divx home video system and discontinue operations,
but existing,registered customers would be able to view discs during a
two-year phase-out period. The operating results of Divx and the loss on
disposal of the Divx business have been segregated from continuing oper-
ations and reported as separate line items,after tax,on the Company’s
statements of earnings for the periods presented.
For fiscal 2000,the loss from the discontinued operations of Divx totaled
$16.2 million after an income tax benefit of $9.9 million. The loss from
the discontinued operations of Divx totaled $68.5 million after an income
tax benefit of $42.0 million in fiscal 1999 and $20.6 million after an
income tax benefit of $12.6 million in fiscal 1998.
In fiscal 2000,the loss on the disposal of the Divx business totaled
$114.0 million after an income tax benefit of $69.9 million. The loss on
the disposal includes a provision for operating losses to be incurred dur-
ing the phase-out period. It also includes provisions for commitments
under licensing agreements with motion picture distributors,the write-
down of assets to net realizable value,lease termination costs, employee
severance and benefit costs and other contractual commitments.
Net Earnings
Net earnings for the Company increased 38 percent to $197.6 million in
fiscal 2000. In fiscal 1999,net earnings rose 37 percent to $142.9 million
from $104.3 million in fiscal 1998.