CarMax 2000 Annual Report Download - page 34
Download and view the complete annual report
Please find page 34 of the 2000 CarMax annual report below. You can navigate through the pages in the report by either clicking on the pages listed below, or by using the keyword search tool below to find specific information within the annual report.-
 1
1 -
2
-
3
-
4
-
5
-
6
-
7
-
8
-
9
-
10
-
11
-
12
-
13
-
14
-
15
-
16
-
17
-
18
-
19
-
20
-
21
-
22
-
23
-
 24
24 -
 25
25 -
 26
26 -
 27
27 -
 28
28 -
 29
29 -
 30
30 -
 31
31 -
 32
32 -
 33
33 -
 34
34 -
 35
35 -
 36
36 -
 37
37 -
 38
38 -
 39
39 -
 40
40 -
 41
41 -
 42
42 -
 43
43 -
 44
44 -
45
-
46
-
47
-
48
-
49
-
50
-
51
-
52
-
53
-
54
-
55
-
56
-
57
-
58
-
59
-
60
-
61
-
62
-
63
-
64
-
65
-
66
-
67
-
68
-
69
-
70
-
71
-
72
-
73
-
74
-
75
-
76
-
77
-
78
-
79
-
80
-
81
-
82
-
83
-
84
-
85
-
86
 |
 |

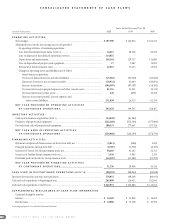
CONSOLIDATED STATEMENTS OF CASH FLOWS
CIRCUIT CITY STORES, INC. 2000 ANNUAL REPORT
32
Years Ended February 29 or 28
(Amounts in thousands) 2000 1999 1998
OPERATING ACTIVITIES:
Net earnings............................................................................................................................. $ 197,590 $ 142,924 $ 104,311
Adjustments to reconcile net earnings to net cash provided
by operating activities of continuing operations:
Loss from discontinued operations [NOTE 15]..................................................................... 16,215 68,546 20,636
Loss on disposal of discontinued operations [NOTE 15]...................................................... 114,025 – –
Depreciation and amortization.......................................................................................... 148,164 129,727 114,860
Loss on disposition of property and equipment................................................................ 17 3,087 14,093
Provision for deferred income taxes................................................................................... 43,053 17,235 15,052
Changes in operating assets and liabilities,net of effects
from business acquisitions:
Decrease in deferred revenue and other liabilities....................................................... (15,565) (33,022) (23,024)
(Increase) decrease in net accounts receivable ............................................................ (18,922) 23,640 (66,061)
Increase in inventory.................................................................................................... (184,507) (97,597) (18,182)
Decrease (increase) in prepaid expenses and other current assets.............................. 81,316 31,257 (6,113)
Decrease (increase) in other assets.............................................................................. 240 (607) 10,359
Increase in accounts payable,accrued expenses and
other current liabilities........................................................................................... 211,850 24,315 62,276
NET CASH PROVIDED BY OPERATING ACTIVITIES
OF CONTINUING OPERATIONS...................................................................... 593,476 309,505 228,207
INVESTING ACTIVITIES:
Cash used in business acquisitions [NOTE 3] ............................................................................ (34,849) (41,562) –
Purchases of property and equipment..................................................................................... (222,268) (352,384) (575,860)
Proceeds from sales of property and equipment..................................................................... 100,151 273,647 297,126
NET CASH USED IN INVESTING ACTIVITIES
OF CONTINUING OPERATIONS...................................................................... (156,966) (120,299) (278,734)
FINANCING ACTIVITIES:
(Payments on) proceeds from issuance of short-term debt,net............................................. (5,011) (960) 5,629
Principal payments on long-term debt.................................................................................... (2,707) (1,301) (6,187)
Issuances of Circuit City Group common stock,net................................................................ 50,205 42,165 22,311
Issuances of CarMax Group common stock,net...................................................................... 3,456 3,983 2,353
Dividends paid on Circuit City Group common stock............................................................. (14,207) (13,981) (13,792)
NET CASH PROVIDED BY FINANCING ACTIVITIES
OF CONTINUING OPERATIONS.................................................................... 31,736 29,906 10,314
CASH USED IN DISCONTINUED OPERATIONS [NOTE 15].......................... (90,193) (69,844) (45,818)
Increase (decrease) in cash and cash equivalents......................................................................... 378,053 149,268 (86,031)
Cash and cash equivalents at beginning of year............................................................................ 265,880 116,612 202,643
Cash and cash equivalents at end of year...................................................................................... $ 643,933 $ 265,880 $ 116,612
SUPPLEMENTAL DISCLOSURES OF CASH FLOW INFORMATION
Cash paid during the year for:
Interest..................................................................................................................................... $ 34,389 $ 31,858 $ 26,697
Income taxes............................................................................................................................ $ 14,908 $ 53,528 $ 47,936
See accompanying notes to consolidated financial statements.