CarMax 2000 Annual Report Download - page 52
Download and view the complete annual report
Please find page 52 of the 2000 CarMax annual report below. You can navigate through the pages in the report by either clicking on the pages listed below, or by using the keyword search tool below to find specific information within the annual report.-
 1
1 -
2
-
3
-
4
-
5
-
6
-
7
-
8
-
9
-
10
-
11
-
12
-
13
-
14
-
15
-
16
-
17
-
18
-
19
-
20
-
21
-
22
-
23
-
24
-
25
-
26
-
27
-
28
-
29
-
30
-
31
-
32
-
33
-
34
-
35
-
36
-
37
-
38
-
39
-
40
-
41
-
 42
42 -
 43
43 -
 44
44 -
 45
45 -
 46
46 -
 47
47 -
 48
48 -
 49
49 -
 50
50 -
 51
51 -
 52
52 -
 53
53 -
 54
54 -
 55
55 -
 56
56 -
 57
57 -
 58
58 -
 59
59 -
 60
60 -
 61
61 -
 62
62 -
63
-
64
-
65
-
66
-
67
-
68
-
69
-
70
-
71
-
72
-
73
-
74
-
75
-
76
-
77
-
78
-
79
-
80
-
81
-
82
-
83
-
84
-
85
-
86
 |
 |

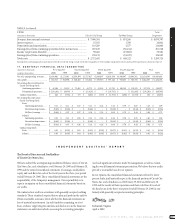
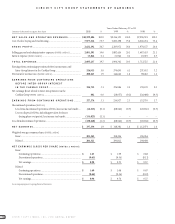
CIRCUIT CITY GROUP STATEMENTS OF EARNINGS
CIRCUIT CITY STORES, INC. 2000 ANNUAL REPORT
50
Years Ended February 29 or 28
(Amounts in thousands except per share data) 2000 % 1999 % 1998 %
NET SALES AND OPERATING REVENUES..................... $10,599,406 100.0 $9,344,170 100.0 $7,996,591 100.0
Cost of sales,buying and warehousing...................................................... 7,977,214 75.3 7,060,198 75.6 6,026,434 75.4
GROSS PROFIT................................................................................. 2,622,192 24.7 2,283,972 24.4 1,970,157 24.6
Selling, general and administrative expenses [NOTES 3 AND 11].................. 2,081,393 19.6 1,882,416 20.1 1,687,453 21.1
Interest expense [NOTES 3 AND 5] ................................................................ 13,844 0.1 21,926 0.2 25,072 0.3
T O T AL EXPENSES.......................................................................... 2,095,237 19.7 1,904,342 20.3 1,712,525 21.4
Earnings from continuing operations before income taxes and
Inter-Group Interest in the CarMax Group.......................................... 526,955 5.0 379,630 4.1 257,632 3.2
Provision for income taxes [NOTES 3 AND 6] ................................................ 200,243 1.9 144,646 1.6 98,462 1.2
EARNINGS FROM CONTINUING OPERATIONS
BEFORE INTER-GROUP INTEREST
IN THE CARMAX GROUP
...................................................... 326,712 3.1 234,984 2.5 159,170 2.0
Net earnings (loss) related to Inter-Group Interest in the
CarMax Group [NOTES 1 AND 2].............................................................. 862 0.0 (18,057) (0.2) (26,460) (0.3)
EARNINGS FROM CONTINUING OPERATIONS........... 327,574 3.1 216,927 2.3 132,710 1.7
Discontinued operations [NOTE 15]:
Loss from discontinued operations of Divx,less income tax benefit.... (16,215) (0.1) (68,546) (0.7) (20,636) (0.3)
Loss on disposal of Divx,including provision for losses
during phase-out period,less income tax benefit ......................... (114,025) (1.1) – – – –
Loss from discontinued operations........................................................... (130,240) (1.2) (68,546) (0.7) (20,636) (0.3)
NET EARNINGS................................................................................ $ 197,334 1.9 $ 148,381 1.6 $ 112,074 1.4
Weighted average common shares [NOTES 2 AND 8]:
Basic..................................................................................................... 201,345 198,304 196,054
Diluted................................................................................................. 204,321 200,812 198,408
NET EARNINGS (LOSS) PER SHARE [NOTES 2 AND 8]:
Basic:
Continuing operations................................................................... $ 1.63 $ 1.09 $ 0.68
Discontinued operations................................................................ (0.65) (0.34) (0.11)
Net earnings................................................................................... $ 0.98 $ 0.75 $ 0.57
Diluted:
Continuing operations................................................................... $ 1.60 $ 1.08 $ 0.67
Discontinued operations................................................................ (0.64) (0.34) (0.10)
Net earnings................................................................................... $ 0.96 $ 0.74 $ 0.57
See accompanying notes to group financial statements.