CarMax 2000 Annual Report Download - page 73
Download and view the complete annual report
Please find page 73 of the 2000 CarMax annual report below. You can navigate through the pages in the report by either clicking on the pages listed below, or by using the keyword search tool below to find specific information within the annual report.-
 1
1 -
2
-
3
-
4
-
5
-
6
-
7
-
8
-
9
-
10
-
11
-
12
-
13
-
14
-
15
-
16
-
17
-
18
-
19
-
20
-
21
-
22
-
23
-
24
-
25
-
26
-
27
-
28
-
29
-
30
-
31
-
32
-
33
-
34
-
35
-
36
-
37
-
38
-
39
-
40
-
41
-
42
-
43
-
44
-
45
-
46
-
47
-
48
-
49
-
50
-
51
-
52
-
53
-
54
-
55
-
56
-
57
-
58
-
59
-
60
-
61
-
62
-
 63
63 -
 64
64 -
 65
65 -
 66
66 -
 67
67 -
 68
68 -
 69
69 -
 70
70 -
 71
71 -
 72
72 -
 73
73 -
 74
74 -
 75
75 -
 76
76 -
 77
77 -
 78
78 -
 79
79 -
 80
80 -
 81
81 -
 82
82 -
 83
83 -
84
-
85
-
86
 |
 |

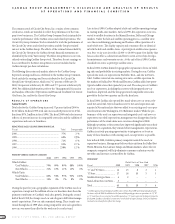
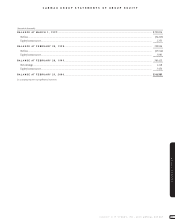
CARMAX GROUP STATEMENTS OF GROUP EQUITY
CIRCUIT CITY STORES, INC. 2000 ANNUAL REPORT 71
CARMAX GROUP
(Amounts in thousands)
BALANCE AT MARCH 1, 1997............................................................................................................................................................... $ 391,816
Net loss............................................................................................................................................................................................................... (34,223)
Equity issuances,net.......................................................................................................................................................................................... 2,353
BALANCE AT FEBRUARY 28, 1998................................................................................................................................................... 359,946
Net loss............................................................................................................................................................................................................... (23,514)
Equity issuances,net.......................................................................................................................................................................................... 3,983
BALANCE AT FEBRUARY 28, 1999................................................................................................................................................... 340,415
Net earnings....................................................................................................................................................................................................... 1,118
Equity issuances,net.......................................................................................................................................................................................... 3,456
BALANCE AT FEBRUARY 29, 2000................................................................................................................................................... $344,989
See accompanying notes to group financial statements.