CarMax 2000 Annual Report Download - page 70
Download and view the complete annual report
Please find page 70 of the 2000 CarMax annual report below. You can navigate through the pages in the report by either clicking on the pages listed below, or by using the keyword search tool below to find specific information within the annual report.-
 1
1 -
2
-
3
-
4
-
5
-
6
-
7
-
8
-
9
-
10
-
11
-
12
-
13
-
14
-
15
-
16
-
17
-
18
-
19
-
20
-
21
-
22
-
23
-
24
-
25
-
26
-
27
-
28
-
29
-
30
-
31
-
32
-
33
-
34
-
35
-
36
-
37
-
38
-
39
-
40
-
41
-
42
-
43
-
44
-
45
-
46
-
47
-
48
-
49
-
50
-
51
-
52
-
53
-
54
-
55
-
56
-
57
-
58
-
59
-
 60
60 -
 61
61 -
 62
62 -
 63
63 -
 64
64 -
 65
65 -
 66
66 -
 67
67 -
 68
68 -
 69
69 -
 70
70 -
 71
71 -
 72
72 -
 73
73 -
 74
74 -
 75
75 -
 76
76 -
 77
77 -
 78
78 -
 79
79 -
 80
80 -
81
-
82
-
83
-
84
-
85
-
86
 |
 |

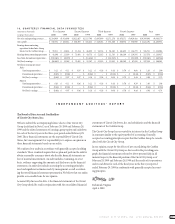
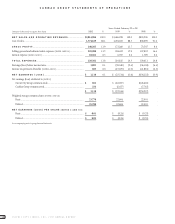
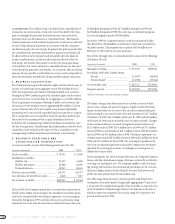
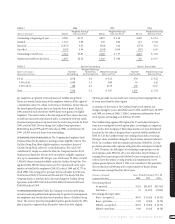
CARMAX GROUP STATEMENTS OF OPERATIONS
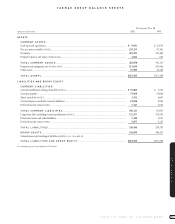
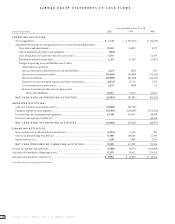
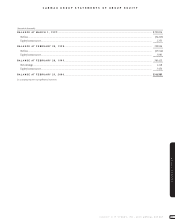
CIRCUIT CITY STORES, INC. 2000 ANNUAL REPORT
68
Years Ended February 29 or 28
(Amounts in thousands except per share data) 2000 % 1999 % 1998 %
NET SALES AND OPERATING REVENUES.......................... $2,014,984 100.0 $1,466,298 100.0 $874,206 100.0
Cost of sales.................................................................................................... 1,774,619 88.1 1,294,032 88.3 800,699 91.6
GROSS PROFIT...................................................................................... 240,365 11.9 172,266 11.7 73,507 8.4
Selling, general and administrative expenses [NOTES 3 AND 13]....................... 228,200 11.3 204,422 13.9 127,822 14.6
Interest expense [NOTES 3 AND 7] ..................................................................... 10,362 0.5 6,393 0.4 1,789 0.2
T O T AL EXPENSES............................................................................... 238,562 11.8 210,815 14.3 129,611 14.8
Earnings (loss) before income taxes.............................................................. 1,803 0.1 (38,549) (2.6) (56,104) (6.4)
Income tax provision (benefit) [NOTES 3 AND 8] .............................................. 685 0.0 (15,035) (1.0) (21,881) (2.5)
NET EARNINGS (LOSS).................................................................. $ 1,118 0.1 $ (23,514) (1.6) $(34,223) (3.9)
Net earnings (loss) attributed to [NOTE 1]:
Circuit City Group common stock............................................................ $ 862 $ (18,057) $(26,460)
CarMax Group common stock.................................................................. 256 (5,457) (7,763)
$ 1,118 $ (23,514) $(34,223)
Weighted average common shares [NOTES 2 AND 10]:
Basic ......................................................................................................... 23,778 22,604 22,001
Diluted...................................................................................................... 25,788 22,604 22,001
NET EARNINGS (LOSS) PER SHARE [NOTES 2 AND 10]:
Basic......................................................................................................... $ 0.01 $ (0.24) $ (0.35)
Diluted...................................................................................................... $ 0.01 $ (0.24) $ (0.35)
See accompanying notes to group financial statements.