CarMax 2000 Annual Report Download - page 41
Download and view the complete annual report
Please find page 41 of the 2000 CarMax annual report below. You can navigate through the pages in the report by either clicking on the pages listed below, or by using the keyword search tool below to find specific information within the annual report.-
 1
1 -
2
-
3
-
4
-
5
-
6
-
7
-
8
-
9
-
10
-
11
-
12
-
13
-
14
-
15
-
16
-
17
-
18
-
19
-
20
-
21
-
22
-
23
-
24
-
25
-
26
-
27
-
28
-
29
-
30
-
 31
31 -
 32
32 -
 33
33 -
 34
34 -
 35
35 -
 36
36 -
 37
37 -
 38
38 -
 39
39 -
 40
40 -
 41
41 -
 42
42 -
 43
43 -
 44
44 -
 45
45 -
 46
46 -
 47
47 -
 48
48 -
 49
49 -
 50
50 -
 51
51 -
52
-
53
-
54
-
55
-
56
-
57
-
58
-
59
-
60
-
61
-
62
-
63
-
64
-
65
-
66
-
67
-
68
-
69
-
70
-
71
-
72
-
73
-
74
-
75
-
76
-
77
-
78
-
79
-
80
-
81
-
82
-
83
-
84
-
85
-
86
 |
 |

CIRCUIT CITY STORES, INC. 2000 ANNUAL REPORT 39
CIRCUIT CITY STORES, INC.
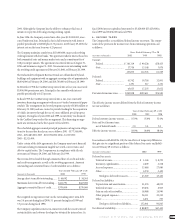
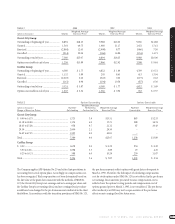
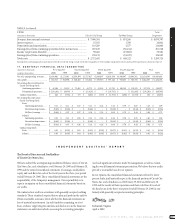
TABLE 1 2000 1999 1998
Weighted Average Weighted Average Weighted Average
(Shares in thousands) Shares Exercise Price Shares Exercise Price Shares Exercise Price
Circuit City Group:
Outstanding at beginning of year.................. 8,894 $18.25 9,988 $16.00 9,656 $14.88
Granted.......................................................... 1,564 40.75 1,080 21.17 1,452 17.61
Exercised........................................................ (2,864) 12.65 (2,008) 8.77 (966) 7.50
Cancelled ....................................................... (214) 22.06 (166) 16.80 (154) 14.71
Outstanding at end of year ............................ 7,380 $25.07 8,894 $18.25 9,988 $16.00
Options exercisable at end of year ................. 1,258 $13.89 2,966 $12.02 3,508 $ 9.84
CarMax Group:
Outstanding at beginning of year.................. 4,380 $ 1.77 4,822 $ 1.49 4,769 $ 0.51
Granted.......................................................... 1,132 5.89 205 8.63 413 13.04
Exercised........................................................ (2,027) 0.22 (543) 0.22 (273) 0.22
Cancelled ....................................................... (161) 6.94 (104) 10.54 (87) 6.36
Outstanding at end of year ............................ 3,324 $ 3.87 4,380 $ 1.77 4,822 $ 1.49
Options exercisable at end of year ................. 1,203 $ 2.54 1,566 $ 0.96 762 $ 0.37
TABLE 2 Options Outstanding Options Exercisable
Weighted Average
(Shares in thousands) Number Remaining Weighted Average Number Weighted Average
Range of Exercise Prices Outstanding Contractual Life Exercise Price Exercisable Exercise Price
Circuit City Group:
$ 9.09 to 14.75 ........................................................... 1,723 3.9 $13.51 883 $12.33
15.18 to 18.00............................................................ 1,176 4.0 17.31 288 16.74
18.43 to 25.28............................................................ 958 4.7 21.12 87 20.43
29.50 ......................................................................... 2,000 2.1 29.50 – –
34.63 to 47.53............................................................ 1,523 6.0 40.81 – –
Total ............................................................................. 7,380 4.0 $25.07 1,258 $13.89
CarMax Group:
$ 0.22......................................................................... 1,638 2.0 $ 0.22 934 $ 0.22
3.90 to 6.06 ............................................................. 1,098 5.3 5.89 19 4.25
6.25 to 16.31 ........................................................... 588 4.0 10.29 250 11.07
Total ............................................................................. 3,324 3.4 $ 3.87 1,203 $ 2.54
the pro forma amounts reflect options with grant dates subsequent to
March 1,1995. Therefore, the full impact of calculating compensation
cost for stock options under SFAS No.123 is not reflected in the pro forma
net earnings (loss) amounts presented because compensation cost is
reflected over the options’ vesting periods and compensation cost of
options granted prior to March 1,1995,is not considered. The pro forma
effect on fiscal year 2000 may not be representative of the pro forma
effects on net earnings (loss) for future years.
The Company applies APB Opinion No.25 and related interpretations in
accounting for its stock option plans. Accordingly, no compensation cost
has been recognized. Had compensation cost been determined based on
the fair value at the grant date consistent with the methods of SFAS No.
123,the Circuit City Group’s net earnings and net earnings per share and
the CarMax Group’s net earnings (loss) and net earnings (loss) per share
would have been changed to the pro forma amounts indicated in the chart
that follows. In accordance with the transition provisions of SFAS No.123,