CarMax 2000 Annual Report Download - page 48
Download and view the complete annual report
Please find page 48 of the 2000 CarMax annual report below. You can navigate through the pages in the report by either clicking on the pages listed below, or by using the keyword search tool below to find specific information within the annual report.-
 1
1 -
2
-
3
-
4
-
5
-
6
-
7
-
8
-
9
-
10
-
11
-
12
-
13
-
14
-
15
-
16
-
17
-
18
-
19
-
20
-
21
-
22
-
23
-
24
-
25
-
26
-
27
-
28
-
29
-
30
-
31
-
32
-
33
-
34
-
35
-
36
-
37
-
 38
38 -
 39
39 -
 40
40 -
 41
41 -
 42
42 -
 43
43 -
 44
44 -
 45
45 -
 46
46 -
 47
47 -
 48
48 -
 49
49 -
 50
50 -
 51
51 -
 52
52 -
 53
53 -
 54
54 -
 55
55 -
 56
56 -
 57
57 -
 58
58 -
59
-
60
-
61
-
62
-
63
-
64
-
65
-
66
-
67
-
68
-
69
-
70
-
71
-
72
-
73
-
74
-
75
-
76
-
77
-
78
-
79
-
80
-
81
-
82
-
83
-
84
-
85
-
86
 |
 |

CIRCUIT CITY GROUP MANAGEMENT’S DISCUSSION AND ANALYSIS OF
RESULTS OF OPERATIONS AND FINANCIAL CONDITION
CIRCUIT CITY STORES, INC. 2000 ANNUAL REPORT
46
The common stock of Circuit City Stores,Inc.consists of two common
stock series,which are intended to reflect the performance of the Com-
pany’s two businesses. The Circuit City Group Common Stock is intended
to track the performance of the Circuit City stores and related operations
and the Group’s retained interest in the CarMax Group. The effects of the
retained interest in the CarMax Group on the Circuit City Group’s finan-
cial statements are identified by the term “Inter-Group.”Over the three-
year period discussed in this annual report, the financial results for the
Company and the Circuit City Group also have included the Company’s
investment in Digital Video Express,which has been discontinued. The
CarMax Group Common Stock is intended to track the performance of
the CarMax stores and related operations. The Inter-Group Interest is not
considered outstanding CarMax Group stock. Therefore, the net earnings
or losses attributed to the Inter-Group Interest are not included in the
CarMax Group’s per share calculations.
The following discussion and analysis relates to the Circuit City Group.
The Circuit City Group held a 74.7 percent interest in the CarMax Group
at February 29, 2000, a 76.6 percent interest at February 28, 1999, and a
77.3 percent interest at February 28, 1998. For additional information,
refer to the “Management’s Discussion and Analysis of Results of Opera-
tions and Financial Condition”for Circuit City Stores, Inc.and for the
CarMax Group.
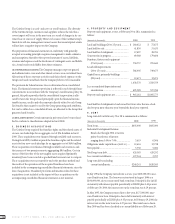
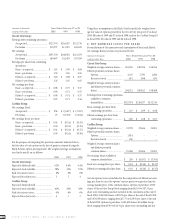
RESULTS OF OPERATIONS
Sales Growth
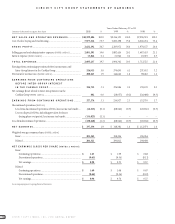
Total sales for the Circuit City Group increased 13 percent in fiscal 2000 to
$10.60 billion. In fiscal 1999, total sales were $9.34 billion,a 17 percent
increase from $8.00 billion in fiscal 1998. The fiscal 2000 total sales
increase reflects an 8 percent increase in comparable store sales and the
net addition of 34 Circuit City Superstores into new and existing Circuit
City markets.
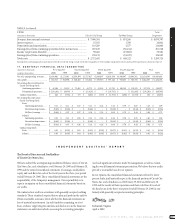
PERCENTAGE SALES CHANGE FROM PRIOR YEAR
Circuit City Group
Fiscal Total Comparable Industry*
2000 ................................................... 13% 8)% 6)%
1999 ................................................... 17% 8)% 5)%
1998 ................................................... 12% (1)% (3)%
1997 ................................................... 6% (8)% (8)%
1996 ................................................... 23% 5)% 6)%
* The industry sales rates are derived from the Consumer Electronics Association, Recording
Industry Association of America and Company estimates of audio, video, home office,telecom-
munications, appliance and music software sales.
PERCENTAGE SALES CHANGE FROM PRIOR YEAR. During the past five years,
industry growth, the addition of new product categories and geographic
expansion of the Group’s Superstore base have made varying contribu-
tions to total sales growth. Early in the period,geographic expansion and
the addition of product categories such as personal computers were the
primary contributors to growth. In fiscal 1996,a 25 percent increase in
Superstore square footage,which included entry into 19 markets,was a
significant contributor to the Group’s total sales growth. In that same
year,home office products rose to 26 percent of sales from 20 percent in
the prior year. From mid fiscal 1996 through fiscal 1998,a lack of signifi-
cant consumer electronics product introductions resulted in weak indus-
try sales. The industry began to emerge from this period of declining
sales in fiscal 1999,and that trend continued in fiscal 2000. Management
believes that this period of industry growth,driven by digital product
technology, can last throughout the decade and will be the primary con-
tributor to total sales growth in the foreseeable future.
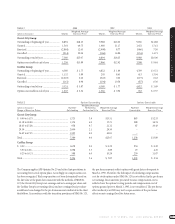
PERCENT MERCHANDISE SALES BY CATEGORY
Fiscal 2000 1999 1998 1997 1996
TV .......................................... 18% 18% 18% 18% 17%
VCR/Camcorders.................... 13% 13% 13% 14% 13%
Audio ...................................... 15% 16% 17% 18% 19%
Home Office............................ 29% 27% 25% 24% 26%
Appliance................................ 14% 15% 15% 15% 14%
Other....................................... 11% 11% 12% 11% 11%
Total ........................................ 100% 100% 100% 100% 100%
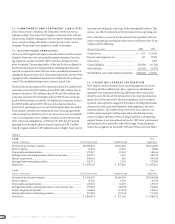
MERCHANDISE SALES BY CATEGORY. Fiscal 2000 sales reflected strong
consumer demand across all major product categories. Home office was
the strongest category,reflecting continued increases in household pene-
tration of personal computers,increased consumer use of the Internet
and new capabilities such as digital imaging and digital audio recording.
In the consumer electronics categories,the Group saw significant demand
for better-featured products and new technologies,including DVD play-
ers,DIRECTV,digital camcorders,wireless communications and big-
screen televisions.
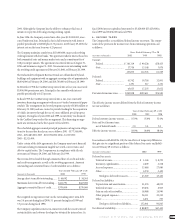
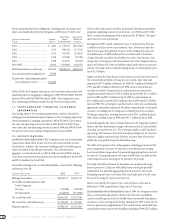
In most states,the Group sells extended warranty programs on behalf of
unrelated third parties who are the primary obligors.Under these third-
party warranty programs,the Company has no contractual liability to the
customer. In states where third-party warranty sales are not permitted,
the Group sells a Circuit City extended warranty for which the Company
is the primary obligor. Gross dollar sales from all extended warranty pro-
grams were 5.4 percent of the Group’s total sales in fiscal 2000 and fiscal
1999,compared with 5.5 percent in fiscal 1998. Total extended warranty
revenue,which is reported in the Group’s total sales,was 4.4 percent of
sales in fiscal 2000 and 4.6 percent of sales in fiscal years 1999 and 1998.
The gross profit margins on products sold with extended warranties are
higher than the gross profit margins on products sold without extended
warranties. Third-party extended warranty revenue was 4.1 percent of
the Group’s total sales in fiscal 2000 and fiscal 1999 and 3.6 percent of the
Group’s total sales in fiscal 1998. The increase in third-party extended
warranty revenue reflects the conversion of stores in 13 states to third-
party warranty sales since early fiscal 1998.
SUPERSTORE SALES PER TOTAL SQUARE FOOT
Fiscal
2000.................................................................................................... $555
1999.................................................................................................... $514
1998.................................................................................................... $478
1997.................................................................................................... $499
1996.................................................................................................... $577