CarMax 2000 Annual Report Download - page 54
Download and view the complete annual report
Please find page 54 of the 2000 CarMax annual report below. You can navigate through the pages in the report by either clicking on the pages listed below, or by using the keyword search tool below to find specific information within the annual report.-
 1
1 -
2
-
3
-
4
-
5
-
6
-
7
-
8
-
9
-
10
-
11
-
12
-
13
-
14
-
15
-
16
-
17
-
18
-
19
-
20
-
21
-
22
-
23
-
24
-
25
-
26
-
27
-
28
-
29
-
30
-
31
-
32
-
33
-
34
-
35
-
36
-
37
-
38
-
39
-
40
-
41
-
42
-
43
-
 44
44 -
 45
45 -
 46
46 -
 47
47 -
 48
48 -
 49
49 -
 50
50 -
 51
51 -
 52
52 -
 53
53 -
 54
54 -
 55
55 -
 56
56 -
 57
57 -
 58
58 -
 59
59 -
 60
60 -
 61
61 -
 62
62 -
 63
63 -
 64
64 -
65
-
66
-
67
-
68
-
69
-
70
-
71
-
72
-
73
-
74
-
75
-
76
-
77
-
78
-
79
-
80
-
81
-
82
-
83
-
84
-
85
-
86
 |
 |

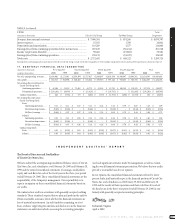
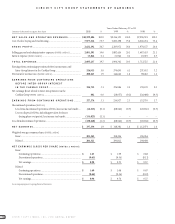
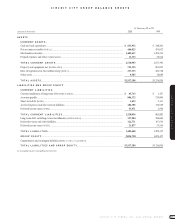
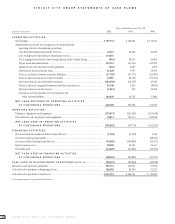
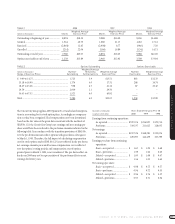
CIRCUIT CITY GROUP STATEMENTS OF CASH FLOWS
CIRCUIT CITY STORES, INC. 2000 ANNUAL REPORT
52
Years Ended February 29 or 28
(Amounts in thousands) 2000 1999 1998
OPERATING ACTIVITIES:
Net earnings............................................................................................................................. $ 197,334 $ 148,381 $ 112,074
Adjustments to reconcile net earnings to net cash provided by
operating activities of continuing operations:
Loss from discontinued operations [NOTE 15]..................................................................... 16,215 68,546 20,636
Loss on disposal of discontinued operations [NOTE 15]....................................................... 114,025 – –
Net (earnings) loss related to Inter-Group Interest in the CarMax Group......................... (862) 18,057 26,460
Depreciation and amortization.......................................................................................... 132,923 119,724 110,283
(Gain) loss on sales of property and equipment................................................................ (418) 3,087 2,593
Provision for deferred income taxes................................................................................... 41,828 5,951 16,919
Decrease in deferred revenue and other liabilities............................................................. (17,799) (32,771) (23,859)
Decrease (increase) in net accounts receivable.................................................................. 12,967 60,138 (33,545)
(Increase) decrease in merchandise inventory................................................................... (144,598) (16,107) 43,528
Decrease (increase) in prepaid expenses and other current assets..................................... 83,540 5,543 (8,856)
(Increase) decrease in other assets.................................................................................... (1,015) 202 10,296
Increase in accounts payable,accrued expenses and
other current liabilities................................................................................................. 184,429 10,745 37,804
NET CASH PROVIDED BY OPERATING ACTIVITIES
OF CONTINUING OPERATIONS...................................................................... 618,569 391,496 314,333
INVESTING ACTIVITIES:
Purchases of property and equipment..................................................................................... (176,873) (214,085) (341,608)
Proceeds from sales of property and equipment..................................................................... 74,811 134,315 199,028
NET CASH USED IN INVESTING ACTIVITIES
OF CONTINUING OPERATIONS...................................................................... (102,062) (79,770) (142,580)
FINANCING ACTIVITIES:
(Decrease) increase in allocated short-term debt,net............................................................. (1,958) (2,180) 5,244
Decrease in inter-group payable.............................................................................................. –– (48,147)
Decrease in allocated long-term debt,net ............................................................................... (74,603) (109,885) (33,573)
Equity issuances,net................................................................................................................ 50,205 42,165 22,311
Dividends paid......................................................................................................................... (14,207) (13,981) (13,792)
NET CASH USED IN FINANCING ACTIVITIES
OF CONTINUING OPERATIONS...................................................................... (40,563) (83,881) (67,957)
CASH USED IN DISCONTINUED OPERATIONS [NOTE 15].......................... (90,193) (69,844) (45,818)
Increase in cash and cash equivalents........................................................................................... 385,751 158,001 57,978
Cash and cash equivalents at beginning of year............................................................................ 248,201 90,200 32,222
Cash and cash equivalents at end of year....................................................................................... $ 633,952 $ 248,201 $ 90,200
See accompanying notes to group financial statements.