CarMax 2000 Annual Report Download - page 53
Download and view the complete annual report
Please find page 53 of the 2000 CarMax annual report below. You can navigate through the pages in the report by either clicking on the pages listed below, or by using the keyword search tool below to find specific information within the annual report.-
 1
1 -
2
-
3
-
4
-
5
-
6
-
7
-
8
-
9
-
10
-
11
-
12
-
13
-
14
-
15
-
16
-
17
-
18
-
19
-
20
-
21
-
22
-
23
-
24
-
25
-
26
-
27
-
28
-
29
-
30
-
31
-
32
-
33
-
34
-
35
-
36
-
37
-
38
-
39
-
40
-
41
-
42
-
 43
43 -
 44
44 -
 45
45 -
 46
46 -
 47
47 -
 48
48 -
 49
49 -
 50
50 -
 51
51 -
 52
52 -
 53
53 -
 54
54 -
 55
55 -
 56
56 -
 57
57 -
 58
58 -
 59
59 -
 60
60 -
 61
61 -
 62
62 -
 63
63 -
64
-
65
-
66
-
67
-
68
-
69
-
70
-
71
-
72
-
73
-
74
-
75
-
76
-
77
-
78
-
79
-
80
-
81
-
82
-
83
-
84
-
85
-
86
 |
 |

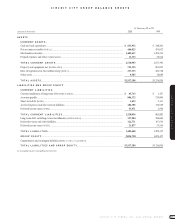
CIRCUIT CITY GROUP BALANCE SHEETS
CIRCUIT CITY STORES, INC. 2000 ANNUAL REPORT 51
CIRCUIT CITY GROUP
At February 29 or 28
(Amounts in thousands) 2000 1999
ASSETS
CURRENT ASSETS:
Cash and cash equivalents................................................................................................................................. $ 633,952 $ 248,201
Net accounts receivable[NOTE 12] ....................................................................................................................... 464,023 476,952
Merchandise inventory....................................................................................................................................... 1,405,617 1,292,215
Prepaid expenses and other current assets........................................................................................................ 13,353 36,024
T O T AL CURRENT ASSETS................................................................................................................. 2,516,945 2,053,392
Property and equipment,net [NOTES 4 AND 5] ..................................................................................................... 753,325 801,827
Inter-Group Interest in the CarMax Group [NOTE 2]........................................................................................... 257,535 260,758
Other assets........................................................................................................................................................ 9,583 18,849
T O T AL ASSETS......................................................................................................................................... $3,537,388 $3,134,826
LIABILITIES AND GROUP EQUITY
CURRENT LIABILITIES:
Current installments of long-term debt [NOTES 5 AND 10].................................................................................... $ 85,735 $ 1,457
Accounts payable ............................................................................................................................................... 884,172 739,895
Short-term debt [NOTE 5].................................................................................................................................... 1,453 3,411
Accrued expenses and other current liabilities.................................................................................................. 184,705 135,029
Deferred income taxes [NOTE 6] .......................................................................................................................... 53,971 2,090
T O T AL CURRENT LIABILITIES...................................................................................................... 1,210,036 881,882
Long-term debt,excluding current installments [NOTES 5 AND 10]...................................................................... 127,984 286,865
Deferred revenue and other liabilities................................................................................................................ 122,771 107,070
Deferred income taxes [NOTE 6] .......................................................................................................................... 21,877 33,536
T O T AL LIABILITIES.............................................................................................................................. 1,482,668 1,309,353
GROUP EQUITY......................................................................................................................................... 2,054,720 1,825,473
Commitments and contingent liabilities [NOTES 1,9, 10,12, 13, 14 AND 15]
T O T AL LIABILITIES AND GROUP EQUITY............................................................................. $3,537,388 $3,134,826
See accompanying notes to group financial statements.