CarMax 2000 Annual Report Download - page 72
Download and view the complete annual report
Please find page 72 of the 2000 CarMax annual report below. You can navigate through the pages in the report by either clicking on the pages listed below, or by using the keyword search tool below to find specific information within the annual report.-
 1
1 -
2
-
3
-
4
-
5
-
6
-
7
-
8
-
9
-
10
-
11
-
12
-
13
-
14
-
15
-
16
-
17
-
18
-
19
-
20
-
21
-
22
-
23
-
24
-
25
-
26
-
27
-
28
-
29
-
30
-
31
-
32
-
33
-
34
-
35
-
36
-
37
-
38
-
39
-
40
-
41
-
42
-
43
-
44
-
45
-
46
-
47
-
48
-
49
-
50
-
51
-
52
-
53
-
54
-
55
-
56
-
57
-
58
-
59
-
60
-
61
-
 62
62 -
 63
63 -
 64
64 -
 65
65 -
 66
66 -
 67
67 -
 68
68 -
 69
69 -
 70
70 -
 71
71 -
 72
72 -
 73
73 -
 74
74 -
 75
75 -
 76
76 -
 77
77 -
 78
78 -
 79
79 -
 80
80 -
 81
81 -
 82
82 -
83
-
84
-
85
-
86
 |
 |

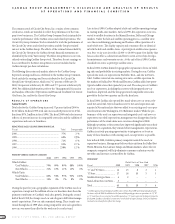
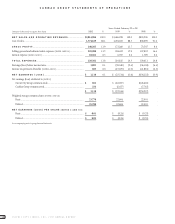
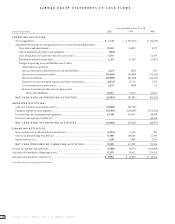
CARMAX GROUP STATEMENTS OF CASH FLOWS
CIRCUIT CITY STORES, INC. 2000 ANNUAL REPORT
70
Years Ended February 29 or 28
(Amounts in thousands) 2000 1999 1998
OPERATING ACTIVITIES:
Net earnings (loss)..................................................................................................................... $ 1,118 $ (23,514) $ (34,223)
Adjustments to reconcile net earnings (loss) to net cash used in operating activities:
Depreciation and amortization............................................................................................ 15,241 10,003 4,577
Gain on disposition of property and equipment.................................................................. (820) – –
Lease termination costs and write-down of assets [NOTE 13] ............................................... 4,755 – 11,500
Provision for deferred income taxes..................................................................................... 1,225 11,284 (1,867)
Changes in operating assets and liabilities,net of effects
from business acquisitions:
Increase (decrease) in deferred revenue and other liabilities......................................... 2,234 (251) 835
Increase in net accounts receivable................................................................................ (31,889) (36,498) (32,516)
Increase in inventory...................................................................................................... (39,909) (81,490) (61,710)
(Increase) decrease in prepaid expenses and other current assets................................ (2,224) 25,714 2,743
Decrease (increase) in other assets................................................................................ 1,255 (809) 63
Increase in accounts payable,accrued expenses and
other current liabilities............................................................................................. 23,921 13,570 24,472
NET CASH USED IN OPERATING ACTIVITIES............................................. (25,093) (81,991) (86,126)
INVESTING ACTIVITIES:
Cash used in business acquisitions [NOTE 4]............................................................................... (34,849) (41,562) –
Purchases of property and equipment....................................................................................... (45,395) (138,299) (234,252)
Proceeds from sales of property and equipment....................................................................... 25,340 139,332 98,098
Decrease in inter-group receivable,net...................................................................................... –– 48,147
NET CASH USED IN INVESTING ACTIVITIES.............................................. (54,904) (40,529) (88,007)
FINANCING ACTIVITIES:
(Decrease) increase in allocated short-term debt,net............................................................... (3,053) 1,220 385
Increase in allocated long-term debt,net .................................................................................. 71,896 108,584 27,386
Equity issuances,net.................................................................................................................. 3,456 3,983 2,353
NET CASH PROVIDED BY FINANCING ACTIVITIES................................ 72,299 113,787 30,124
Decrease in cash and cash equivalents............................................................................................ (7,698) (8,733) (144,009)
Cash and cash equivalents at beginning of year.............................................................................. 17,679 26,412 170,421
Cash and cash equivalents at end of year......................................................................................... $ 9,981 $ 17,679 $ 26,412
See accompanying notes to group financial statements.