CarMax 2000 Annual Report Download - page 66
Download and view the complete annual report
Please find page 66 of the 2000 CarMax annual report below. You can navigate through the pages in the report by either clicking on the pages listed below, or by using the keyword search tool below to find specific information within the annual report.-
 1
1 -
2
-
3
-
4
-
5
-
6
-
7
-
8
-
9
-
10
-
11
-
12
-
13
-
14
-
15
-
16
-
17
-
18
-
19
-
20
-
21
-
22
-
23
-
24
-
25
-
26
-
27
-
28
-
29
-
30
-
31
-
32
-
33
-
34
-
35
-
36
-
37
-
38
-
39
-
40
-
41
-
42
-
43
-
44
-
45
-
46
-
47
-
48
-
49
-
50
-
51
-
52
-
53
-
54
-
55
-
 56
56 -
 57
57 -
 58
58 -
 59
59 -
 60
60 -
 61
61 -
 62
62 -
 63
63 -
 64
64 -
 65
65 -
 66
66 -
 67
67 -
 68
68 -
 69
69 -
 70
70 -
 71
71 -
 72
72 -
 73
73 -
 74
74 -
 75
75 -
 76
76 -
77
-
78
-
79
-
80
-
81
-
82
-
83
-
84
-
85
-
86
 |
 |

CARMAX GROUP MANAGEMENT’S DISCUSSION AND ANALYSIS OF RESULTS
OF OPERATIONS AND FINANCIAL CONDITION
CIRCUIT CITY STORES, INC. 2000 ANNUAL REPORT
64
The common stock of Circuit City Stores,Inc.consists of two common
stock series,which are intended to reflect the performance of the Com-
pany’s two businesses. The CarMax Group Common Stock is intended to
track the performance of the CarMax stores and related operations. The
Circuit City Group Common Stock is intended to track the performance of
the Circuit City stores and related operations and the Group’s retained
interest in the CarMax Group. The effects of the retained interest held by
the Circuit City Group on the CarMax Group’s financial statements are
identified by the term “Inter-Group.”The Inter-Group Interest is not con-
sidered outstanding CarMax Group stock. Therefore,the net earnings or
losses attributed to the Inter-Group Interest are not included in the
CarMax Group’s per share calculations.
The following discussion and analysis relates to the CarMax Group.
Reported earnings and losses attributed to the CarMax Group Common
Stock exclude the earnings and losses attributed to the Circuit City
Group’s Inter-Group Interest, which was 74.7 percent at February 29,
2000,76.6 percent at February 28,1999,and 77.3 percent at February 28,
1998. For additional information,refer to the “Management’s Discussion
and Analysis of Results of Operations and Financial Condition”for Circuit
City Stores,Inc.and for the Circuit City Group.
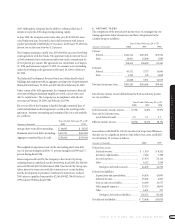
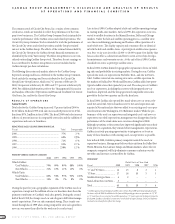
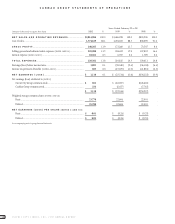
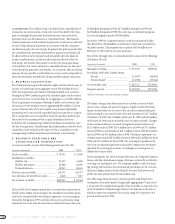
RESULTS OF OPERATIONS
Sales Growth
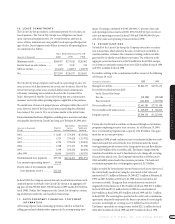
Total sales for the CarMax Group increased 37 percent in fiscal 2000 to
$2.01 billion. In fiscal 1999, total sales increased 68 percent to $1.47 bil-
lion from $874.2 million in fiscal 1998. The fiscal 2000 total sales increase
reflects a 2 percent increase in comparable store sales and the addition of
superstores and new-car franchises.
PERCENTAGE SALES CHANGE FROM PRIOR YEAR
Fiscal Total Comparable
2000...................................................................... 37% 2)%
1999...................................................................... 68% (2)%
1998...................................................................... 71% 6)%
1997...................................................................... 85% 23)%
1996...................................................................... 258% 12)%
PERCENT VEHICLE SALES BY CATEGORY
2000 1999 1998 1997 1996
Vehicle Dollars:
Used Vehicles........................... 79% 90% 89% 88% 100%
New Vehicles............................ 21% 10% 11% 12% 0%
Vehicle Units:
Used Vehicles........................... 86% 94% 93% 92% 100%
New Vehicles............................ 14% 6% 7% 8% 0%
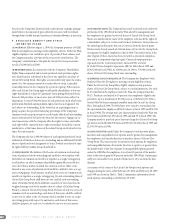
During the past five years,geographic expansion of the CarMax used-car
superstore concept and the addition of new-car franchises have been the
primary contributors to CarMax’s total sales growth. During the second
half of fiscal 1998,the Group’s used-car sales began to fall below manage-
ment’s expectations. New-car sales remained strong. These trends con-
tinued through fiscal 1999 when strong comparable store sales growth in
new cars was more than offset by the weak used-car sales trend.
Late in fiscal 1999, CarMax adopted a hub and satellite operating strategy
in existing multi-store markets. In fiscal 1999,five superstores were con-
verted to satellite locations in the Miami,Houston,Dallas and Chicago
markets. Under the hub and satellite operating process,a satellite store
uses the reconditioning,purchasing and business office operations of a
nearby hub store. The display capacity and consumer offer are identical
in both the hub and satellite stores. A prototypical satellite store operates
on a four- to six-acre site with a 12,000- to 14,000-square-foot facility that
houses sales offices,a showroom and four to seven service bays for regu-
lar maintenance and warranty service. At the end of fiscal 1999, CarMax
classified two stores as prototype satellite stores.
In fiscal 2000,CarMax limited its geographic expansion to focus on build-
ing sales and profitability in existing markets. During the year,CarMax
opened one used-car superstore in Nashville, Tenn., and one in Duarte,
Calif. CarMax converted one existing store into a satellite operation. In
the markets of Dallas/Fort Worth and Houston,CarMax added two proto-
typical satellite stores that opened at year-end. The sales pace at CarMax’s
used-car superstores, including those stores with integrated new-car
franchises,improved,and the Group generated comparable store sales
growth for the last two quarters and for the fiscal year.
In fiscal 2000,CarMax also opened five stand-alone new-car stores, relo-
cated its Laurel, Md.,Toyota franchise next to its Laurel superstore and
acquired a Nissan franchise that was added to an existing used-car super-
store location in the Washington,D.C./Baltimore market.While the per-
formance of the used-car superstores and integrated used- and new-car
superstores exceeded expectations,management was disappointed in the
performance of the stand-alone new-car stores during fiscal 2000.
Although operations at these stores have improved significantly versus their
levels prior to acquisition,they remain below management’s expectations.
CarMax is actively pursuing opportunities to integrate or co-locate as
many of these franchises with existing used-car superstores as possible.
Late in fiscal 2000, CarMax’s primary competitor exited the used-car
superstore business. Management believes their exit from the Dallas/Fort
Worth, Houston,San Antonio, Tampa and Miami markets,where the two
companies competed,will help eliminate consumer confusion over the
two offers and increase customer flow for CarMax.
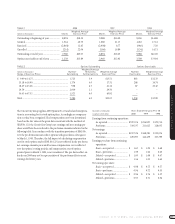
STORE MIX*
Retail Units at Year-End
Fiscal 2000 1999 1998 1997 1996
“C”and “B”Stores ................. 14 13 8 2 1
“A”Store................................. 17 16 10 5 3
Satellite Prototype Store........ 4 2 – – –
Stand-Alone New-Car Store... 5 – – – –
Total ...................................... 40 31 18 7 4
* CarMax opened two prototypical satellite stores in late fiscal 1999 and two prototypical satel-
lite stores in fiscal 2000. In addition to the four satellite prototype stores in operation, six “A,”“B”
or “C”stores have been converted to satellite operations.“C”stores represent the largest format. In
fiscal 2000, CarMax reclassified certain stores on the basis of square footage. Prior year informa-
tion has been reclassified to reflect this change.