CarMax 2000 Annual Report Download - page 67
Download and view the complete annual report
Please find page 67 of the 2000 CarMax annual report below. You can navigate through the pages in the report by either clicking on the pages listed below, or by using the keyword search tool below to find specific information within the annual report.-
 1
1 -
2
-
3
-
4
-
5
-
6
-
7
-
8
-
9
-
10
-
11
-
12
-
13
-
14
-
15
-
16
-
17
-
18
-
19
-
20
-
21
-
22
-
23
-
24
-
25
-
26
-
27
-
28
-
29
-
30
-
31
-
32
-
33
-
34
-
35
-
36
-
37
-
38
-
39
-
40
-
41
-
42
-
43
-
44
-
45
-
46
-
47
-
48
-
49
-
50
-
51
-
52
-
53
-
54
-
55
-
56
-
 57
57 -
 58
58 -
 59
59 -
 60
60 -
 61
61 -
 62
62 -
 63
63 -
 64
64 -
 65
65 -
 66
66 -
 67
67 -
 68
68 -
 69
69 -
 70
70 -
 71
71 -
 72
72 -
 73
73 -
 74
74 -
 75
75 -
 76
76 -
 77
77 -
78
-
79
-
80
-
81
-
82
-
83
-
84
-
85
-
86
 |
 |

CIRCUIT CITY STORES, INC. 2000 ANNUAL REPORT 65
CARMAX GROUP
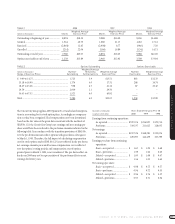
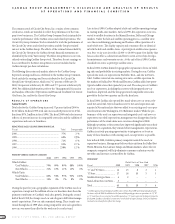
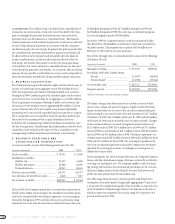
NEW-CAR FRANCHISES*
New-Car Franchises
Fiscal 2000 1999 1998 1997 1996
Integrated/Co-Located
New-Car Franchises........ 15 16 2 1 –
Stand-Alone New-Car
Franchises....................... 5 – – – –
Total New-Car Franchises..... 20 16 2 1 –
* In fiscal 2000, CarMax reclassified certain franchises as “co-located.”Prior period information
has been reclassified to reflect this change.
In most states,CarMax sells extended warranties on behalf of an unrelated
third party who is the primary obligor.Under this third-party warranty
program,the Company has no contractual liability to the customer. In
states where third-party warranty sales are not permitted,CarMax has
sold its own extended warranty for which the Company is the primary
obligor. Gross dollar sales from all extended warranty programs were
3.7 percent of the Group’s total sales in fiscal 2000,4.3 percent in fiscal
1999 and 3.8 percent in fiscal 1998. The fiscal 2000 decrease reflects the
increase in new-car sales as a percentage of the overall mix. The fiscal
1999 increase reflects pricing adjustments and a higher penetration
rate achieved by extending warranty coverage to more vehicles. Total
extended warranty revenue,which is reported in the Group’s total sales,
was 1.6 percent of total sales in fiscal 2000,2.0 percent in fiscal 1999 and
1.5 percent in fiscal 1998. Third-party extended warranty revenue was
1.6 percent of total sales in fiscal 2000,1.9 percent in fiscal 1999 and
1.4 percent in fiscal 1998.
IMPACT OF INFLATION. Inflation has not been a significant contributor to
the Group’s results. The Group’s profitability is based on achieving spe-
cific gross profit dollars per unit rather than on average retail prices.
Because the wholesale market generally adjusts to reflect retail price
trends,management believes that if the stores meet inventory turn objec-
tives then changes in average retail prices will have only a short-term
impact on the Group’s gross margin and thus profitability.
Cost of Sales
The gross profit margin was 11.9 percent in fiscal 2000,11.7 percent in
fiscal 1999 and 8.4 percent in fiscal 1998. At the end of fiscal 1998, CarMax
instituted a profit improvement plan that included better inventory
management,increased retail service sales,pricing adjustments and the
addition of consumer electronic accessory sales. The success of this plan
was the significant contributor to the improved gross profit margins in
fiscal 2000 and fiscal 1999. The significant increase in new-car sales as
a percentage of total sales partly offset the fiscal 2000 and fiscal 1999
improvements since new vehicles carry lower gross profit margins than
used vehicles.
Selling, General and Administrative Expenses
Selling, general and administrative expenses were 11.3 percent of sales in
fiscal 2000, 13.9 percent of sales in fiscal 1999 and 14.6 percent of sales in
fiscal 1998. The improved selling,general and administrative expense ratio
in fiscal 2000 reflects expense leverage from the total and comparable
store sales increases and productivity improvements resulting from the
slower expansion rate,implementation of the hub and satellite operating
strategy,and operating expense controls. The improvements were partly
offset by $4.8 million in charges related to lease termination costs on
undeveloped property and a write-down of assets associated with excess
property for sale. Excluding these costs,the fiscal 2000 expense ratio
would have been 11.1 percent of sales. The higher ratios in fiscal 1999
and fiscal 1998 reflect the costs associated with the expansion of CarMax
superstores and the below-plan sales in a number of multi-store metro-
politan markets. The fiscal 1998 ratio also includes an $11.5 million
write-down of assets associated with the closure and disposal of the Group’s
centralized reconditioning facilities and excess property at some locations.
Excluding the write-down of assets,the selling,general and administra-
tive expense ratio would have been 13.3 percent of sales in fiscal 1998.
Profits generated by CarMax’s finance operation and fees received for
arranging financing through third parties are recorded as a reduction to
selling,general and administrative expenses.
Interest Expense
Interest expense was 0.5 percent of sales in fiscal 2000, 0.4 percent of
sales in fiscal 1999 and 0.2 percent of sales in fiscal 1998. During fiscal
2000 and fiscal 1999,interest expense was incurred primarily on allo-
cated debt to fund new store growth,franchise acquisitions and working
capital, including inventory. In fiscal 1998,interest expense was incurred
primarily on an inter-group note used to finance inventory for much of
the year.
Earnings (Loss) Before Income Taxes
Earnings before income taxes were $1.8 million in fiscal 2000. The fiscal
2000 pretax earnings exceeded management’s expectations. At the end of
fiscal 2000, CarMax recorded a pretax charge of $4.8 million relating to
lease termination costs on undeveloped property and the write-down of
assets associated with excess property for sale. Excluding these charges,
earnings before income taxes were $6.6 million.
For fiscal 1999,CarMax recorded a pretax loss of $38.5 million. This loss
exceeded management’s expectations and reflected the underperfor-
mance of stores in some multi-store metropolitan markets. The fiscal
1998 pretax loss,which includes an $11.5 million write-down of assets,
was $56.1 million. Excluding the write-down,the fiscal 1998 pretax loss
was $44.6 million.
Income Taxes
The Group’s effective income tax rate was 38.0 percent in fiscal 2000,
compared with 39.0 percent in fiscal 1999 and fiscal 1998. In fiscal 1999
and fiscal 1998,the CarMax Group generated losses and as a result
recorded related income tax benefits.
Net Earnings (Loss)
Net earnings were $1.1 million in fiscal 2000. Excluding the lease termi-
nation costs and the write-down of assets, net earnings would have been
$4.1 million compared with a net loss of $23.5 million in fiscal 1999. In
fiscal 1998, the net loss was $34.2 million. Excluding the impact of the
write-down of assets,the fiscal 1998 net loss was $27.2 million.