CarMax 2000 Annual Report Download - page 25
Download and view the complete annual report
Please find page 25 of the 2000 CarMax annual report below. You can navigate through the pages in the report by either clicking on the pages listed below, or by using the keyword search tool below to find specific information within the annual report.-
 1
1 -
2
-
3
-
4
-
5
-
6
-
7
-
8
-
9
-
10
-
11
-
12
-
13
-
14
-
 15
15 -
 16
16 -
 17
17 -
 18
18 -
 19
19 -
 20
20 -
 21
21 -
 22
22 -
 23
23 -
 24
24 -
 25
25 -
 26
26 -
 27
27 -
 28
28 -
 29
29 -
 30
30 -
 31
31 -
 32
32 -
 33
33 -
 34
34 -
 35
35 -
36
-
37
-
38
-
39
-
40
-
41
-
42
-
43
-
44
-
45
-
46
-
47
-
48
-
49
-
50
-
51
-
52
-
53
-
54
-
55
-
56
-
57
-
58
-
59
-
60
-
61
-
62
-
63
-
64
-
65
-
66
-
67
-
68
-
69
-
70
-
71
-
72
-
73
-
74
-
75
-
76
-
77
-
78
-
79
-
80
-
81
-
82
-
83
-
84
-
85
-
86
 |
 |

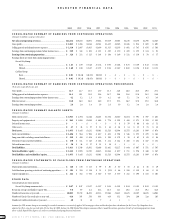
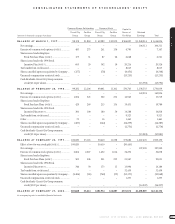
REPORTED HISTORICAL INFORMATION
CIRCUIT CITY STORES, INC. 2000 ANNUAL REPORT 23
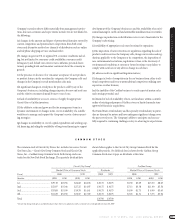
CIRCUIT CITY STORES, INC.
The common stock of Circuit City Stores, Inc. consists of two common
stock series,which are intended to reflect the performance of the Com-
pany’s two businesses. The Circuit City Group Common Stock is intended
to track the performance of the Circuit City stores and related operations
and the Group’s retained interest in the CarMax Group. The effects of the
retained interest in the CarMax Group on the Circuit City Group’s finan-
cial statements are identified by the term “Inter-Group.”Over the three-
year period discussed in this annual report,the financial results for the
Company and the Circuit City Group also have included the Company’s
investment in Digital Video Express, which has been discontinued. The
CarMax Group Common Stock is intended to track the performance of
the CarMax stores and related operations. The Inter-Group Interest is not
considered outstanding CarMax Group stock. Therefore,the net earnings
or losses attributed to the Inter-Group Interest are not included in the
CarMax Group’s per share calculations.
The following discussion and analysis refers to Circuit City Stores, Inc.,
which includes the operations related to both Groups. For additional
information,refer to the “Management’s Discussion and Analysis of
Results of Operations and Financial Condition”for each Group.
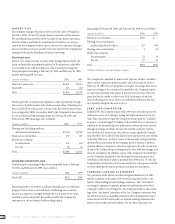
RESULTS OF OPERATIONS
Sales Growth
Total sales for Circuit City Stores, Inc.increased 17 percent in fiscal 2000
to $12.61 billion. In fiscal 1999, total sales increased 22 percent to $10.81
billion from $8.87 billion in fiscal 1998.
PERCENTAGE SALES CHANGE FROM PRIOR YEAR
Circuit City Circuit City CarMax
Stores, Inc. Group Group
Fiscal Total Total Comparable Total Comparable
2000.............. 17% 13% 8)% 37% 2)%
1999.............. 22% 17% 8)% 68% (2)%
1998.............. 16% 12% (1)% 71% 6)%
1997.............. 9% 6% (8)% 85% 23)%
1996.............. 26% 23% 5)% 258% 12)%
(Amounts in thousands except per share data) 2000 1999 1998 1997 1996
Net sales and operating revenues................................................. $12,614,390 $10,810,468 $8,870,797 $7,663,811 $7,029,123
Earnings from continuing operations.......................................... $ 327,830 $ 211,470 $ 124,947 $ 144,234 $ 184,184
Loss from discontinued operations.............................................. $ (130,240) $ (68,546) $ (20,636) $ (7,820) $ (4,809)
Net earnings................................................................................. $ 197,590 $ 142,924 $ 104,311 $ 136,414 $ 179,375
Net earnings (loss) per share:
Circuit City Group:
Basic:
Continuing operations................................................ $ 1.63 $ 1.09 $ 0.68 $ 0.74 $ 0.95
Discontinued operations............................................. $ (0.65) $ (0.34) $ (0.11) $ (0.04) $ (0.02)
Net earnings................................................................ $ 0.98 $ 0.75 $ 0.57 $ 0.70 $ 0.93
Diluted:
Continuing operations................................................ $ 1.60 $ 1.08 $ 0.67 $ 0.73 $ 0.94
Discontinued operations............................................. $ (0.64) $ (0.34) $ (0.10) $ (0.04) $ (0.02)
Net earnings................................................................ $ 0.96 $ 0.74 $ 0.57 $ 0.69 $ 0.92
CarMax Group:
Basic.................................................................................. $ 0.01 $ (0.24) $ (0.35) $ (0.01) $ –
Diluted.............................................................................. $ 0.01 $ (0.24) $ (0.35) $ (0.01) $ –
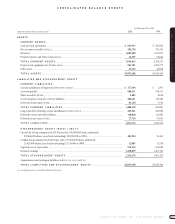
Total assets................................................................................... $ 3,955,348 $ 3,445,266 $3,231,701 $3,081,173 $2,526,022
Long-term debt,excluding current installments.......................... $ 249,241 $ 426,585 $ 424,292 $ 430,290 $ 399,161
Deferred revenue and other liabilities.......................................... $ 130,020 $ 112,085 $ 145,107 $ 166,295 $ 214,001
Cash dividends per share paid on
Circuit City Group common stock.......................................... $ 0.07 $ 0.07 $ 0.07 $ 0.07 $ 0.06
See notes to consolidated financial statements.
CIRCUIT CITY STORES, INC. MANAGEMENT’S DISCUSSION AND ANALYSIS
OF RESULTS OF OPERATIONS AND FINANCIAL CONDITION